Latest South Florida TRENDS Summary BY One Sotheby's

Patrick Meyer

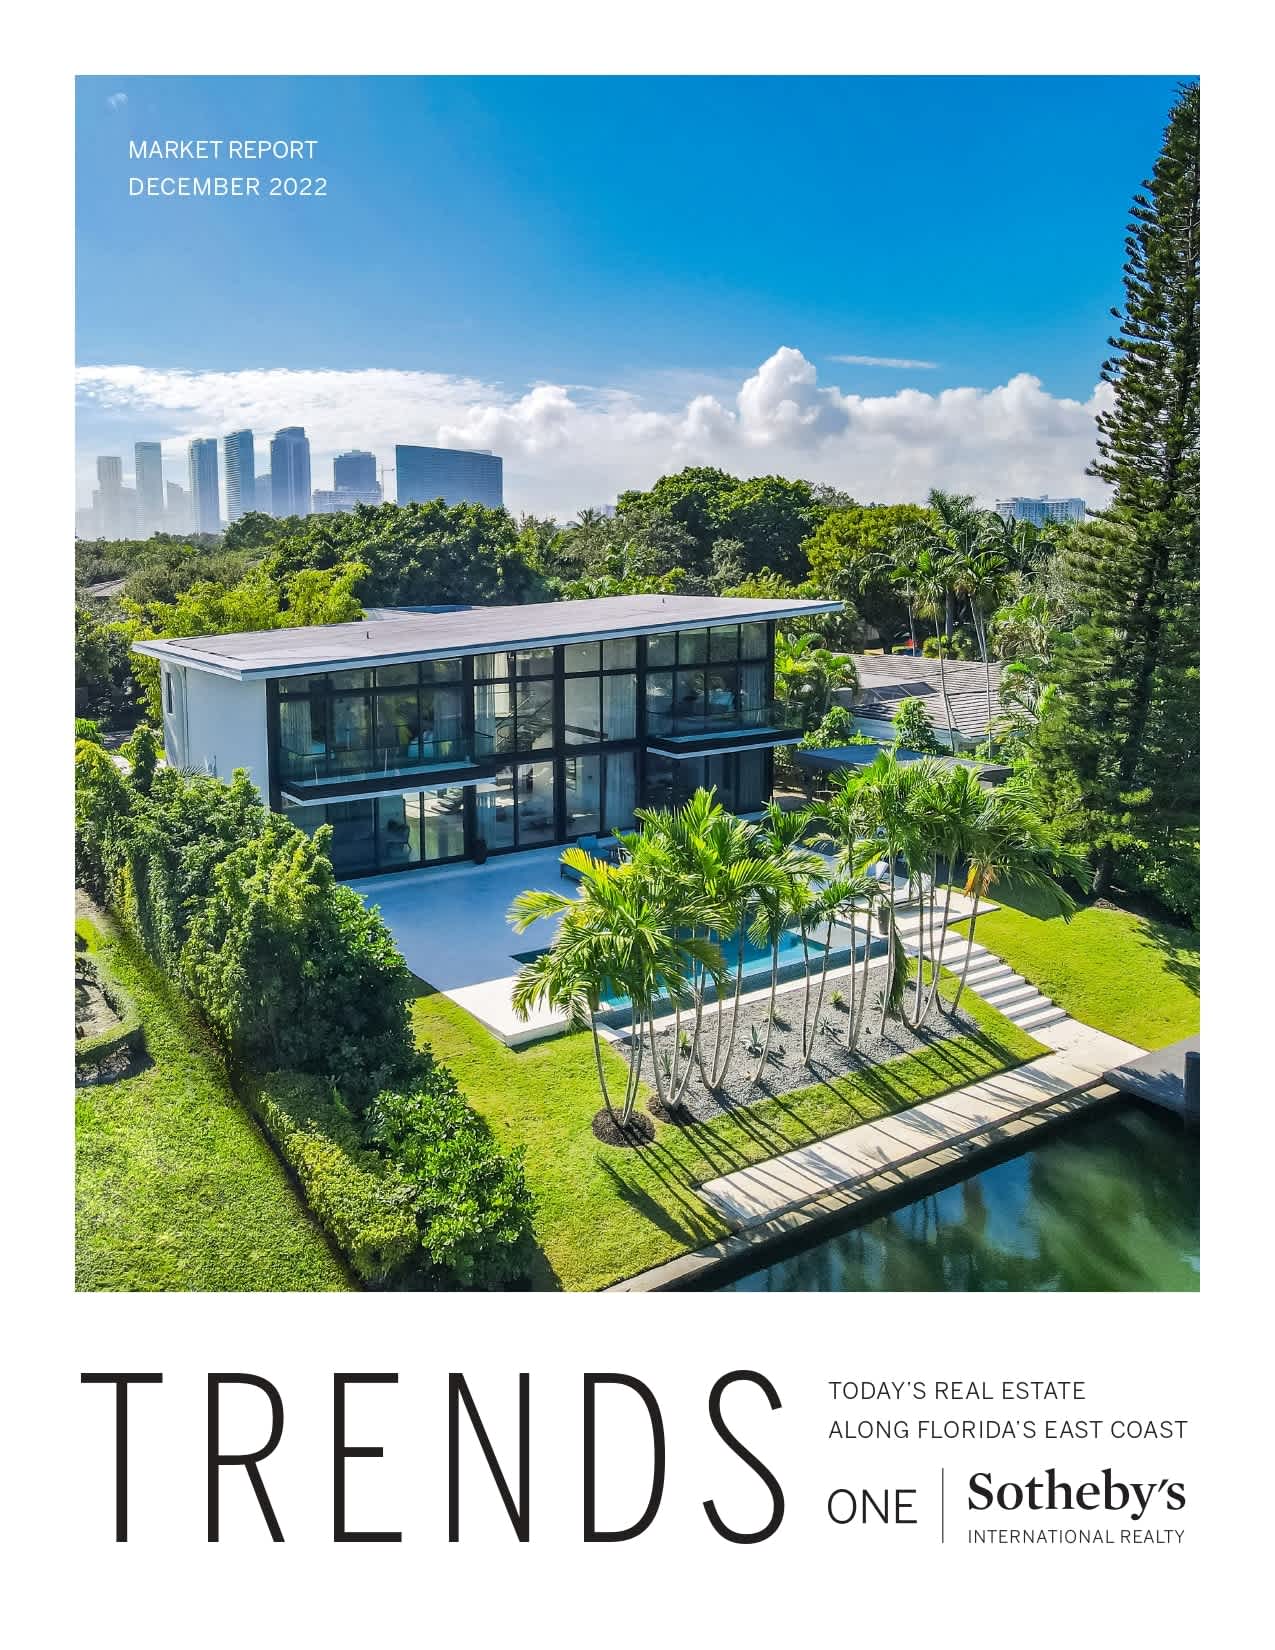
December 2022 Trends market report cover featuring a modern waterfront home and distant city skyline.

TRENDS market report page with Florida East Coast real estate commentary and Daniel de la Vega’s portrait.


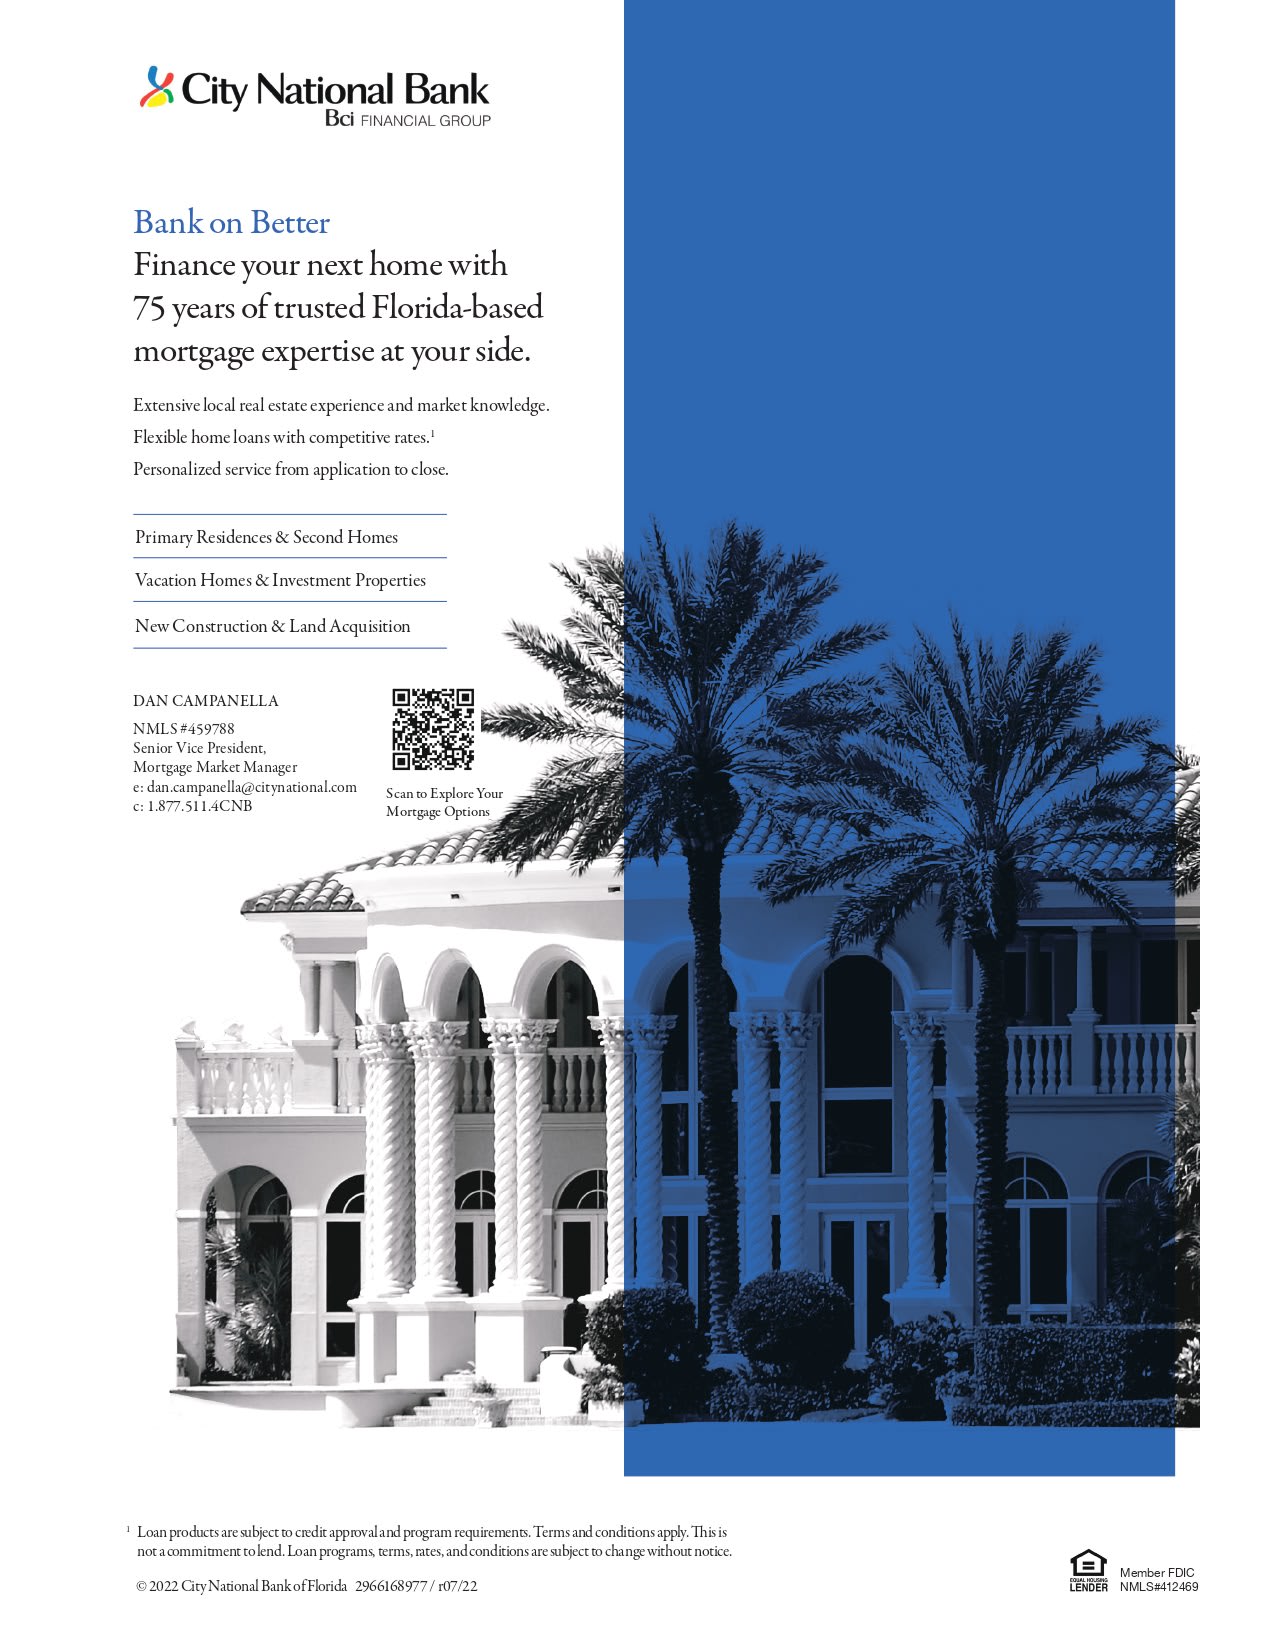
City National Bank mortgage flyer promoting Florida home loans, with a Mediterranean-style home and palm trees.

ONE Sotheby's International Realty, official real estate partner of the Miami Heat.

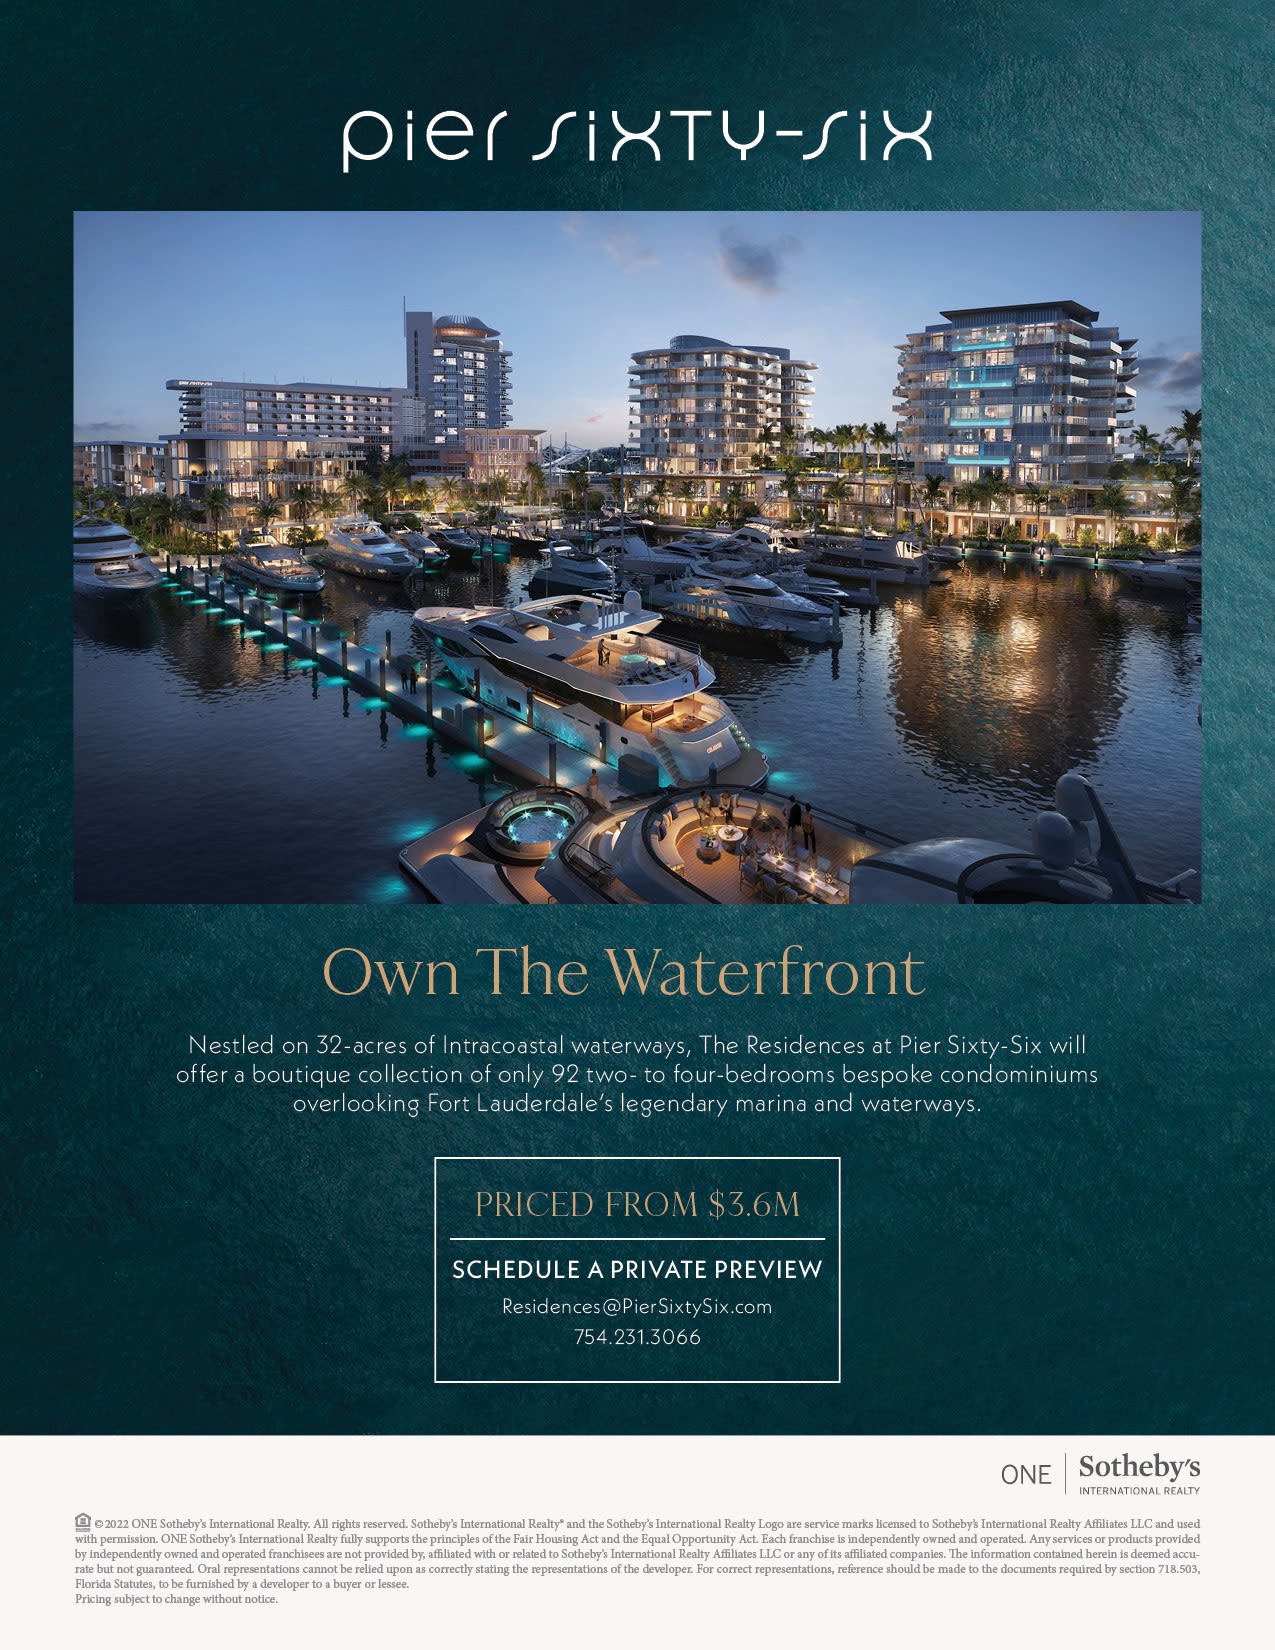
Pier Sixty-Six waterfront residences advertisement with a dusk rendering of condominium towers and yachts in the marina.

Surf Row Residences flyer featuring a rooftop terrace, pool, outdoor lounge seating, and coastal city view.

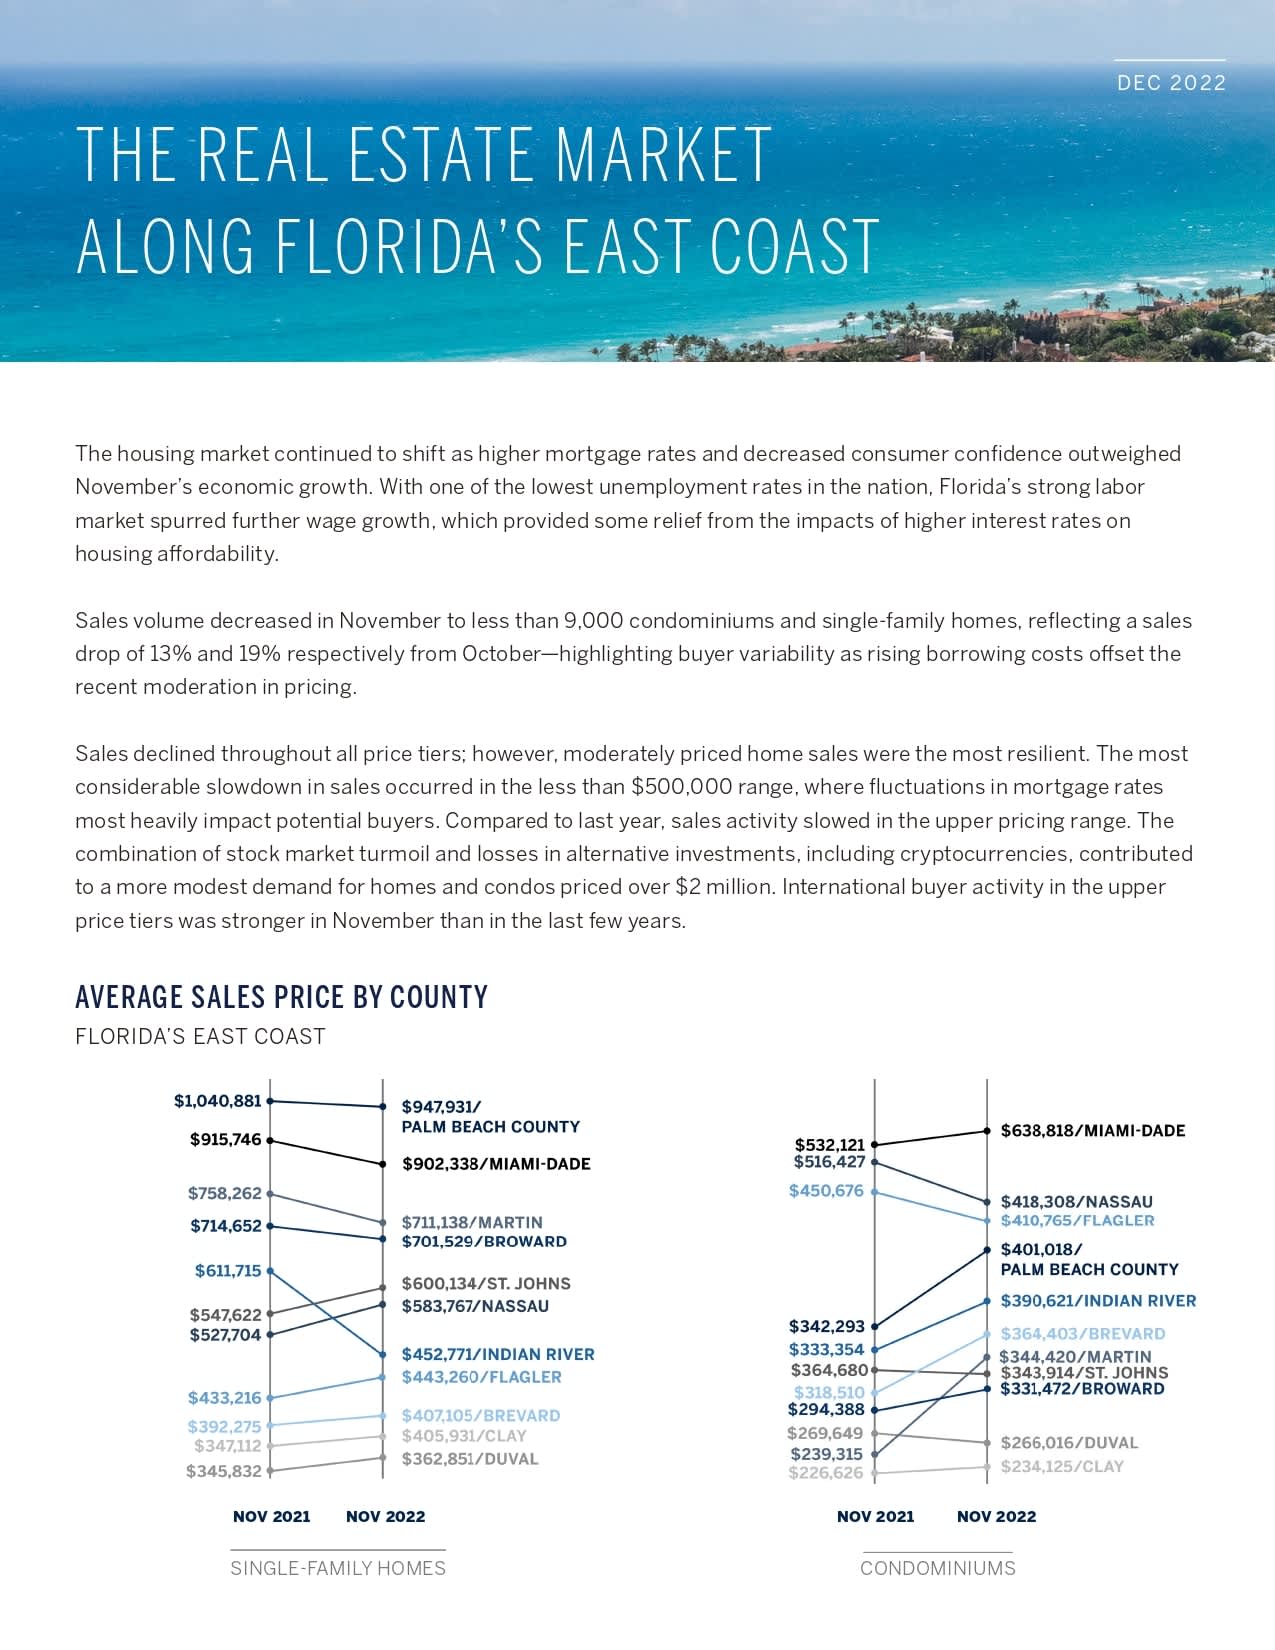
South Florida real estate market report with November 2021–2022 county price charts for homes and condominiums.

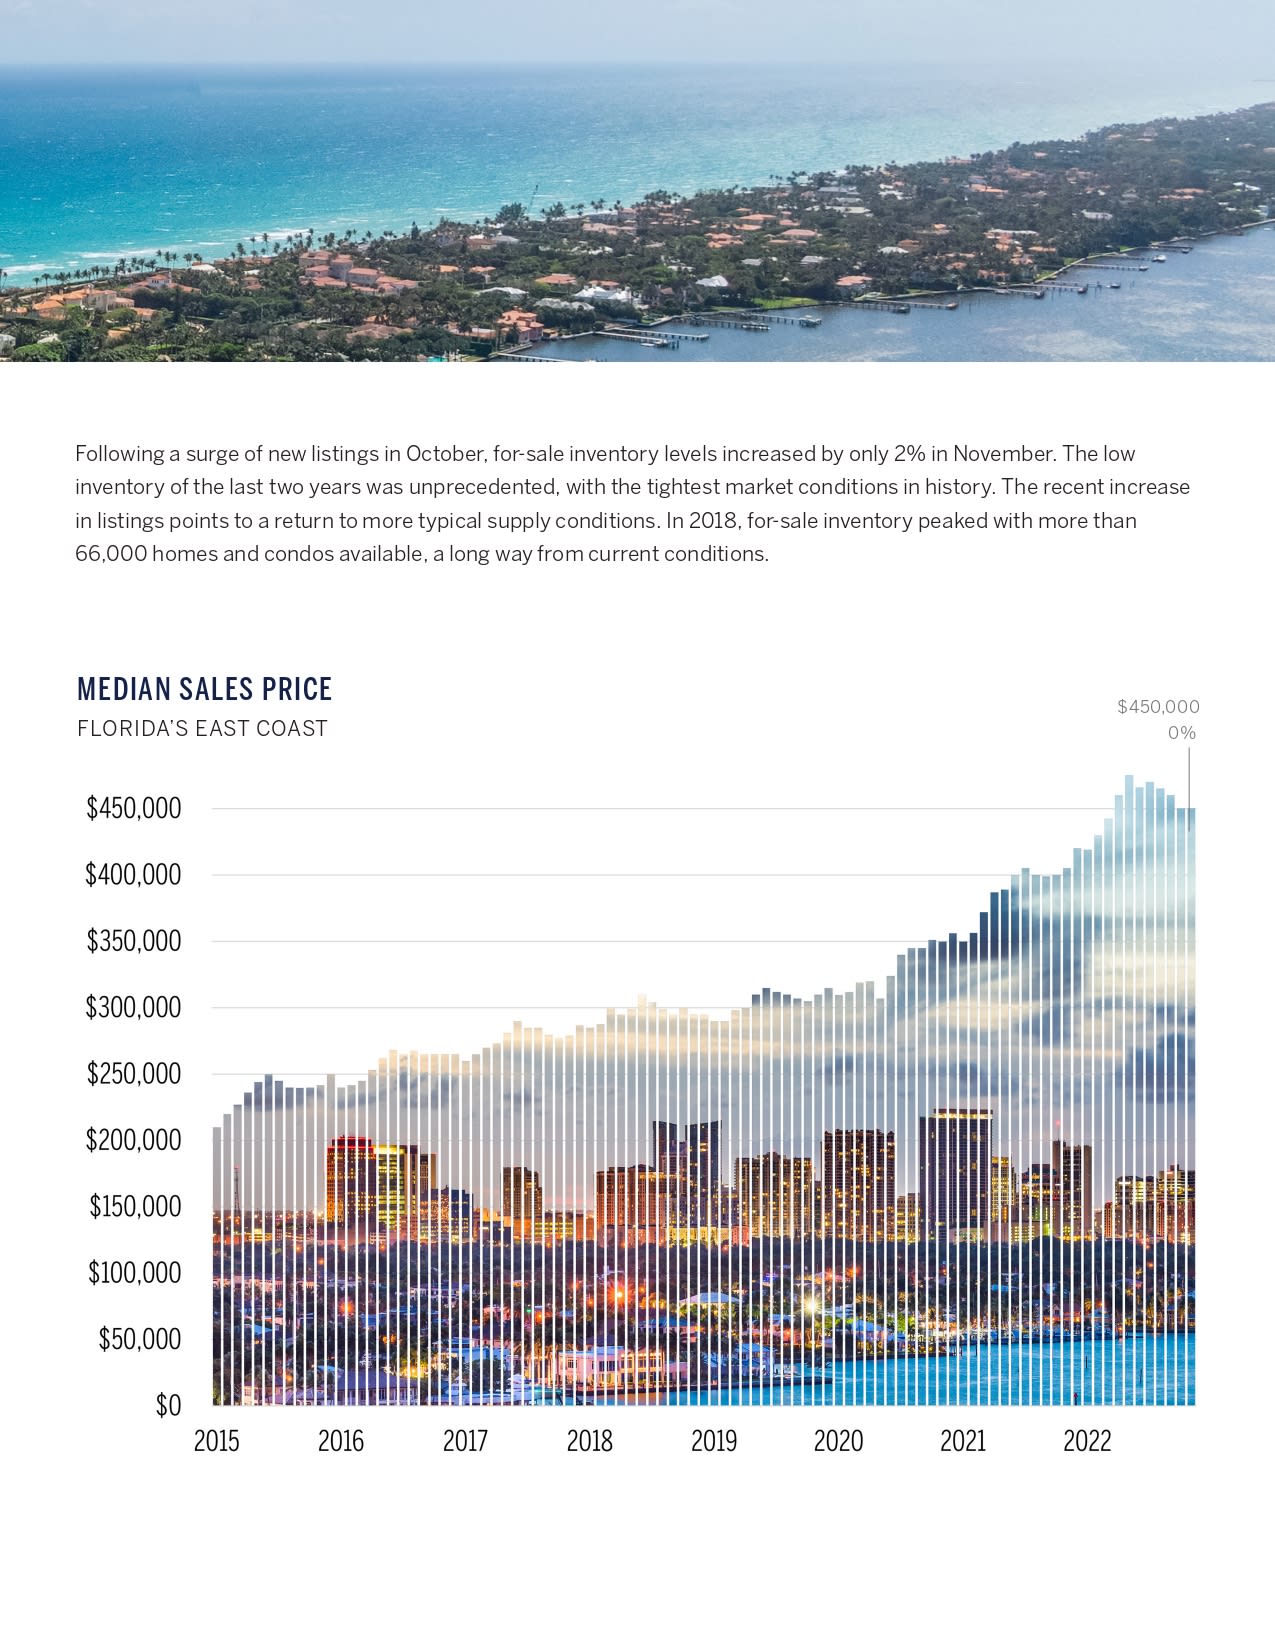
Florida East Coast median sales price chart, with rising prices from 2015 to 2022 beneath an aerial coastal view.

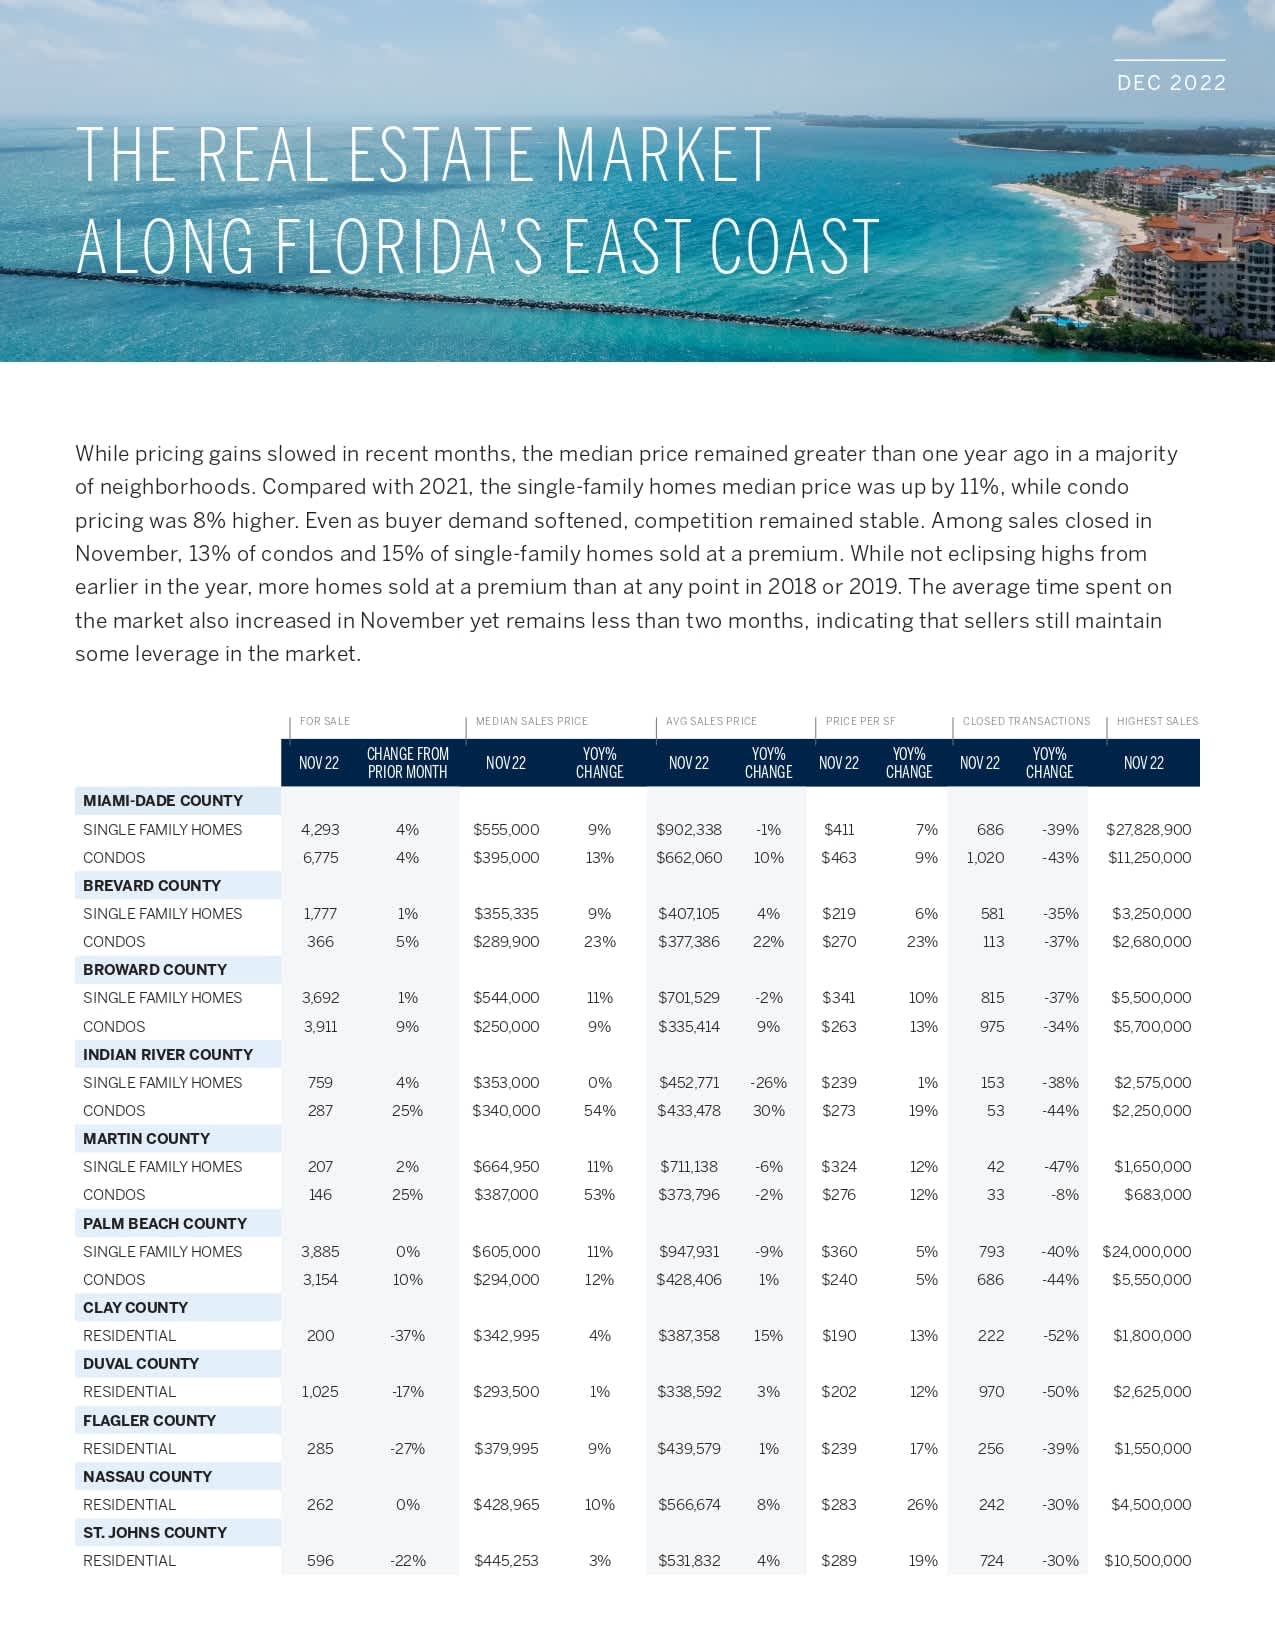
December 2022 Florida east coast real estate market report with a coastal aerial and county sales statistics.

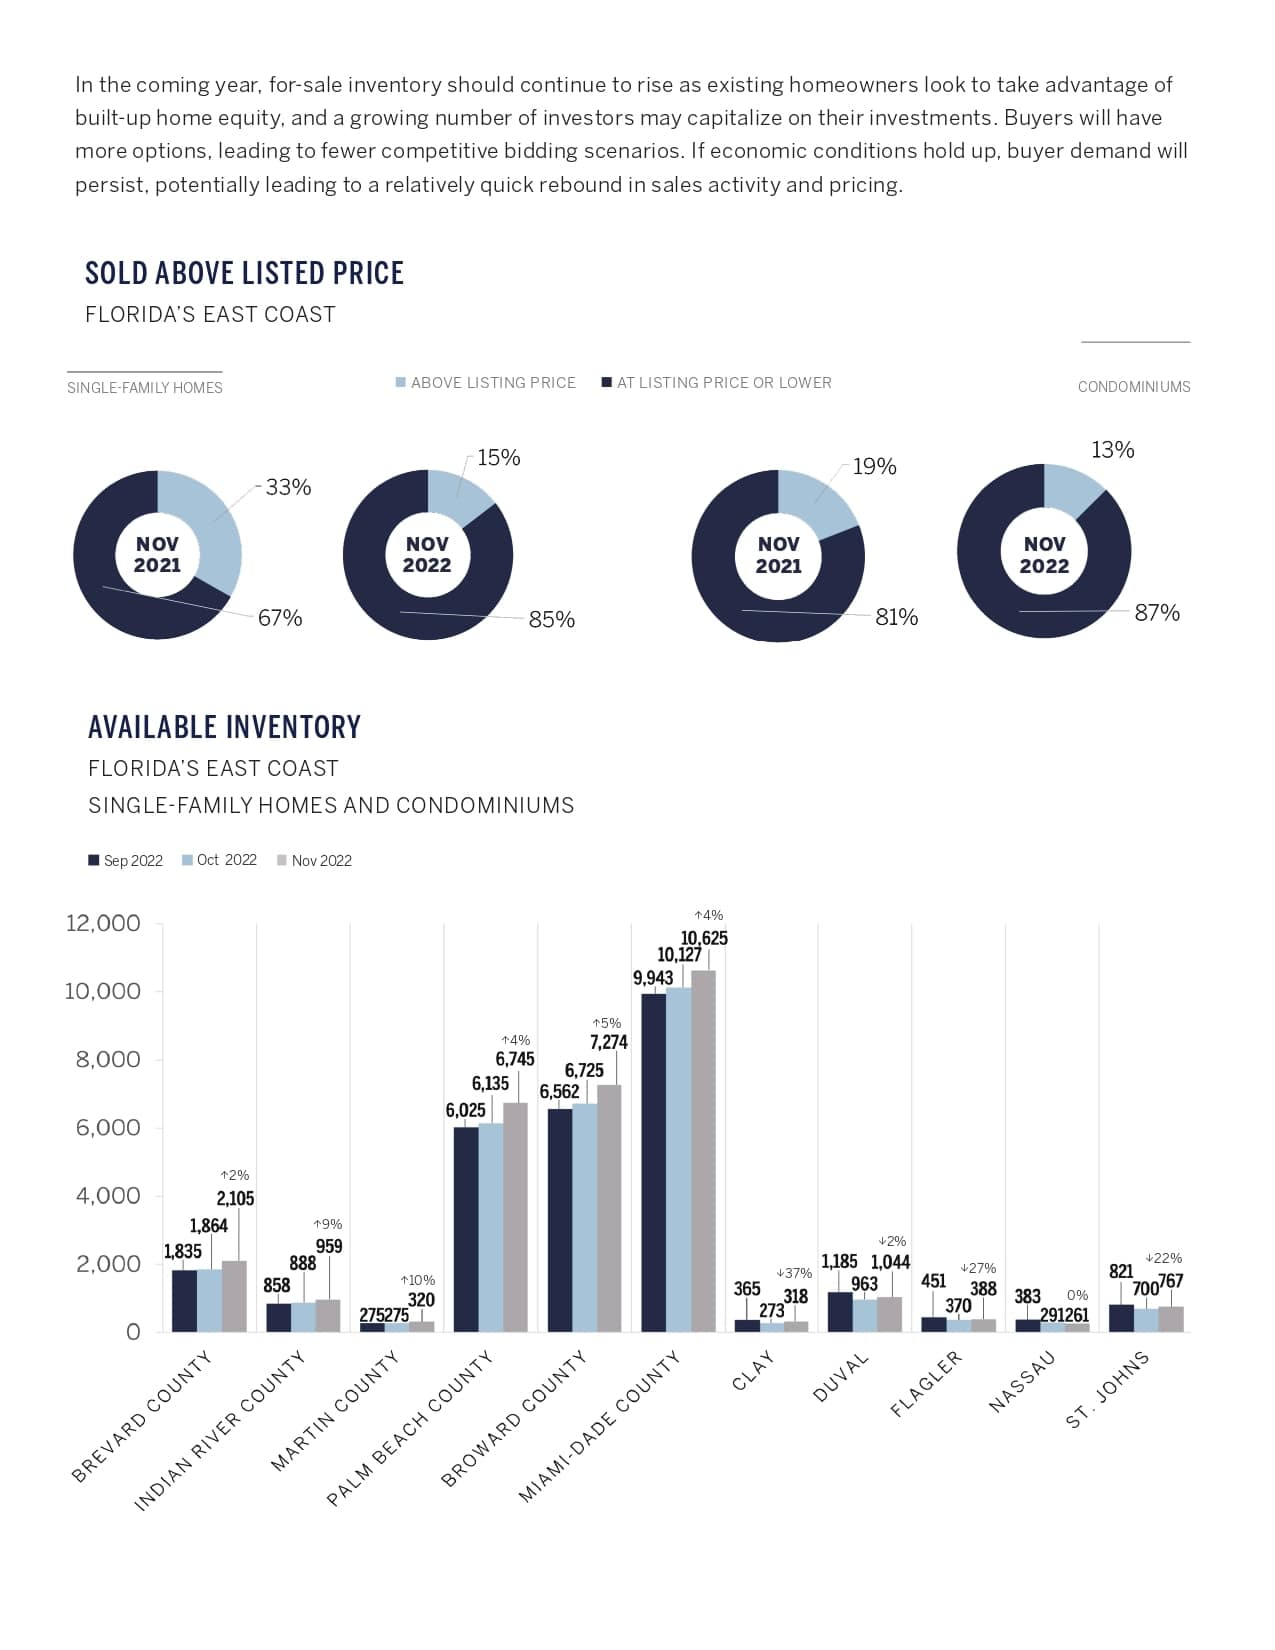
South Florida real estate infographic comparing sale prices and available inventory by county.

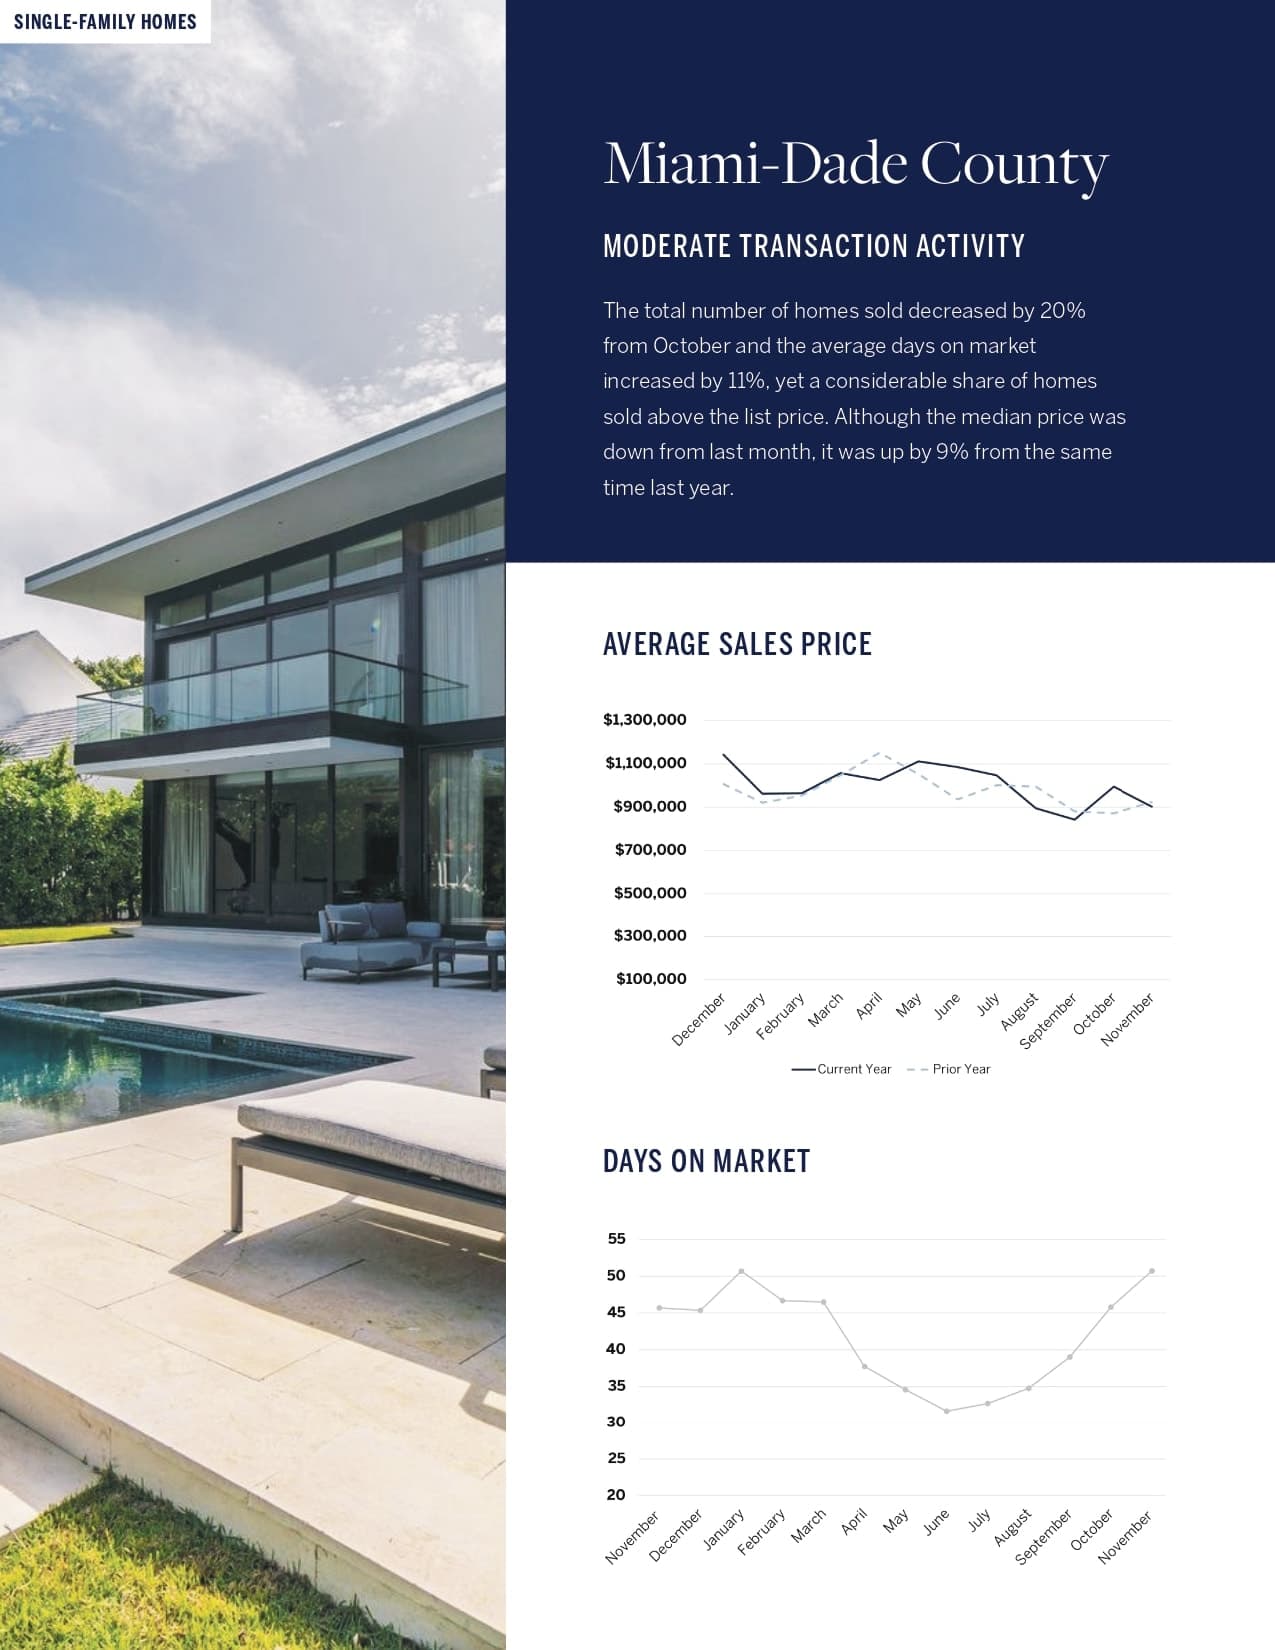
Miami-Dade County single-family home market infographic with a modern poolside house and sales charts.

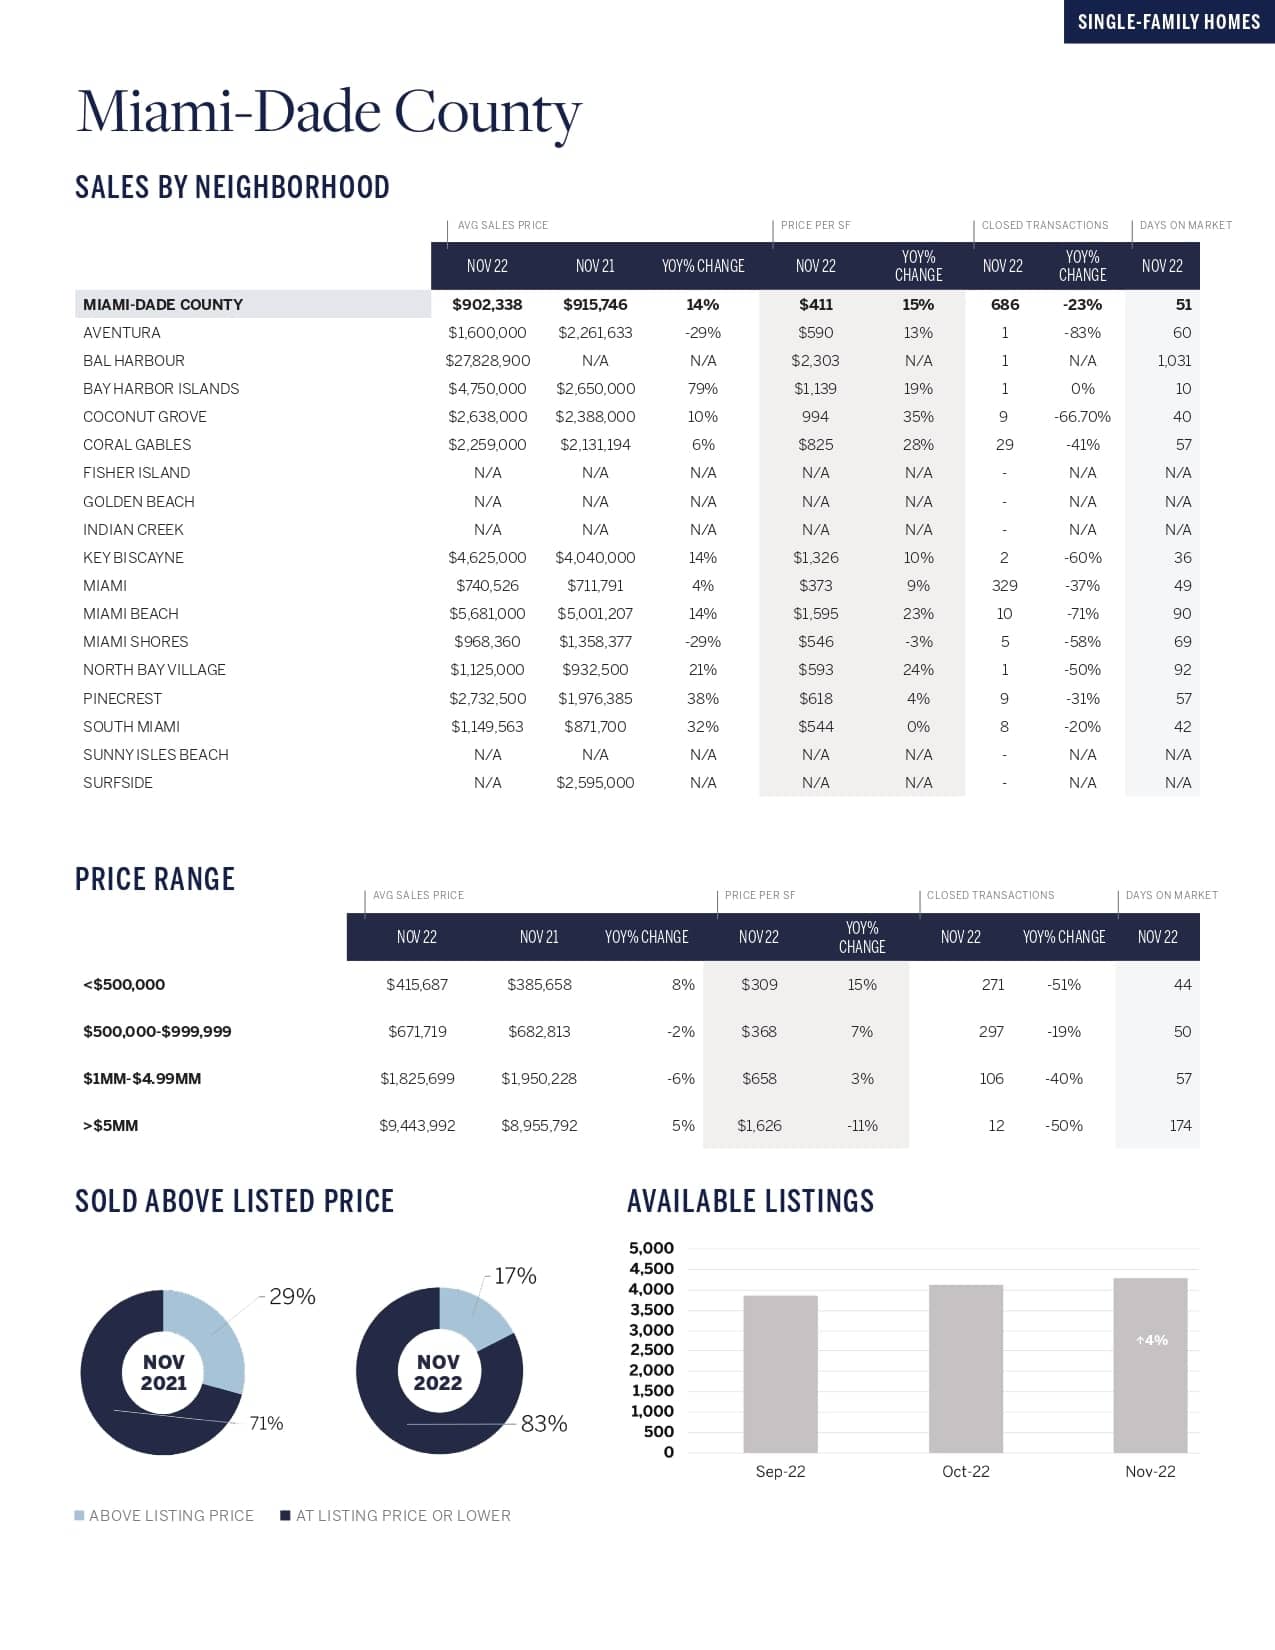
Miami-Dade County single-family home market infographic with neighborhood sales tables and November 2022 charts.


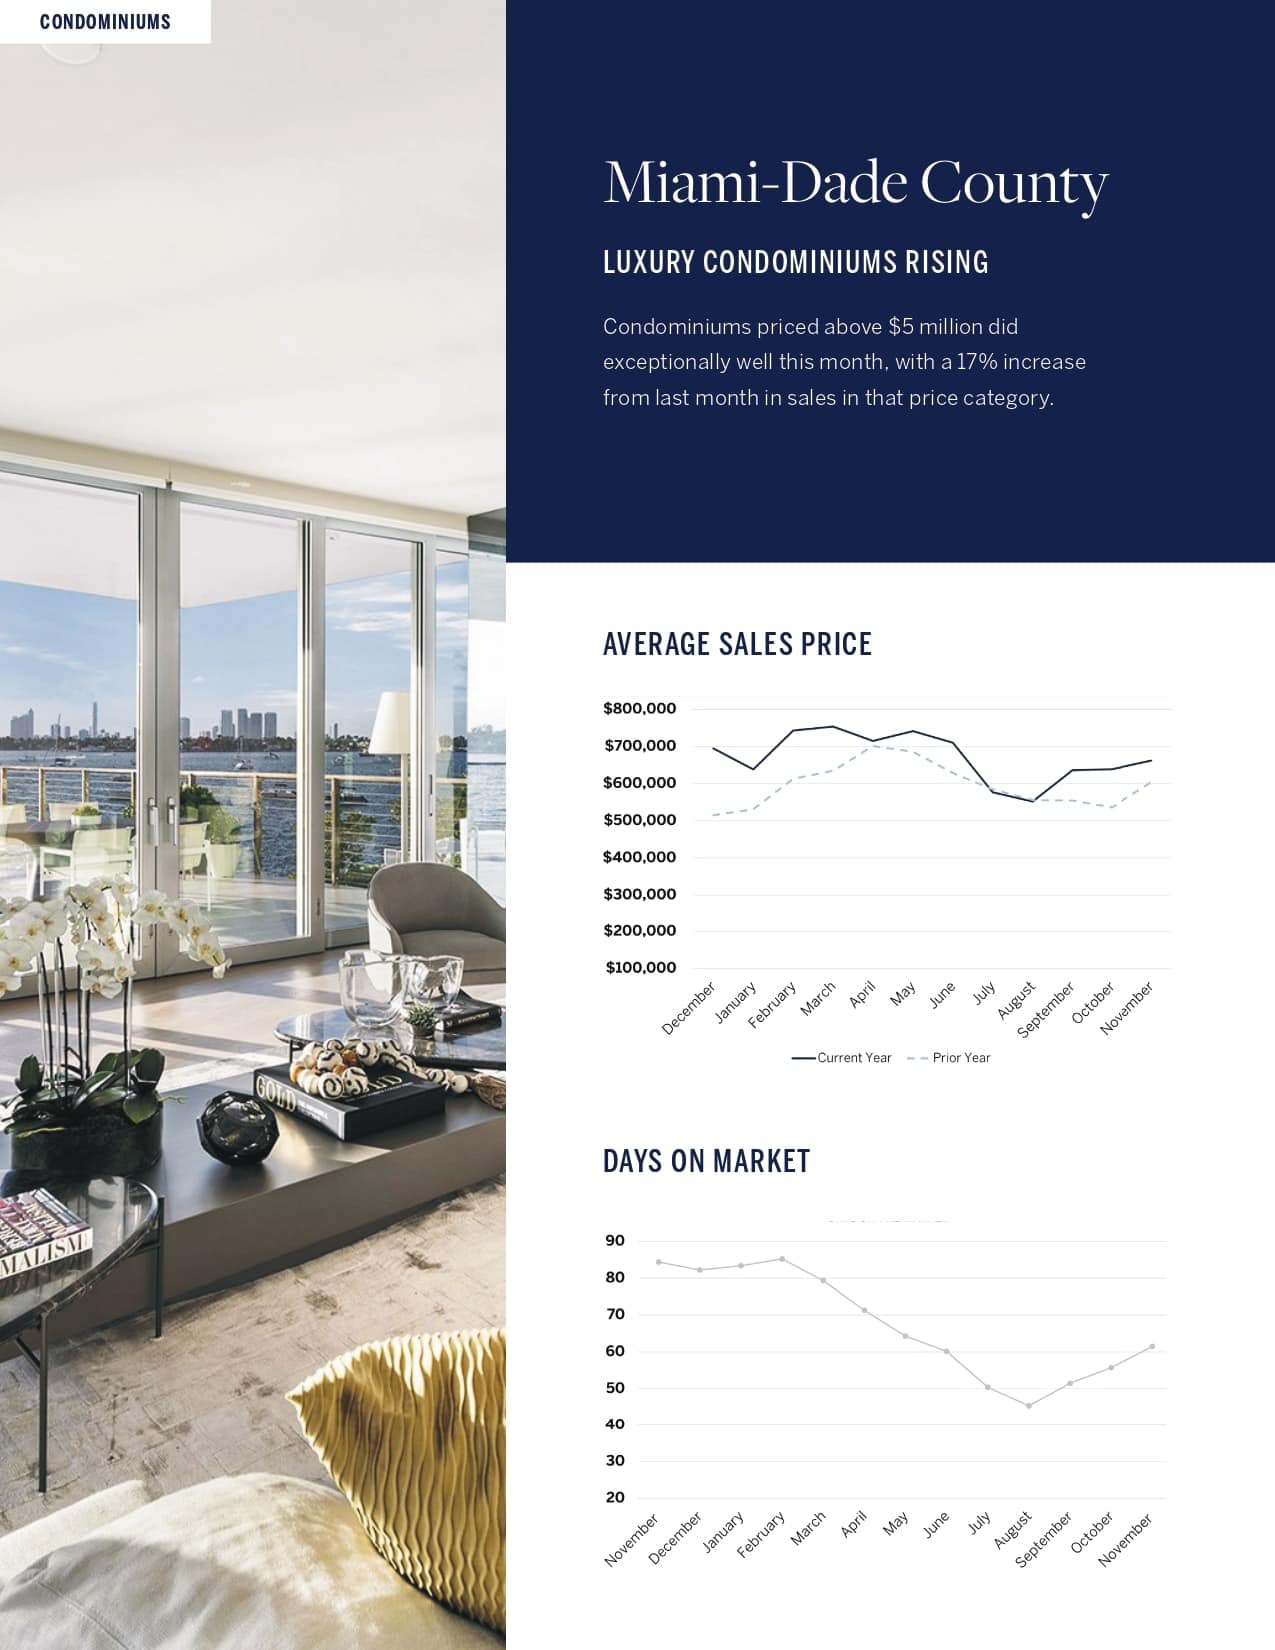
Miami-Dade County condominium trends infographic with a waterfront living room photo and charts for prices and days on market.

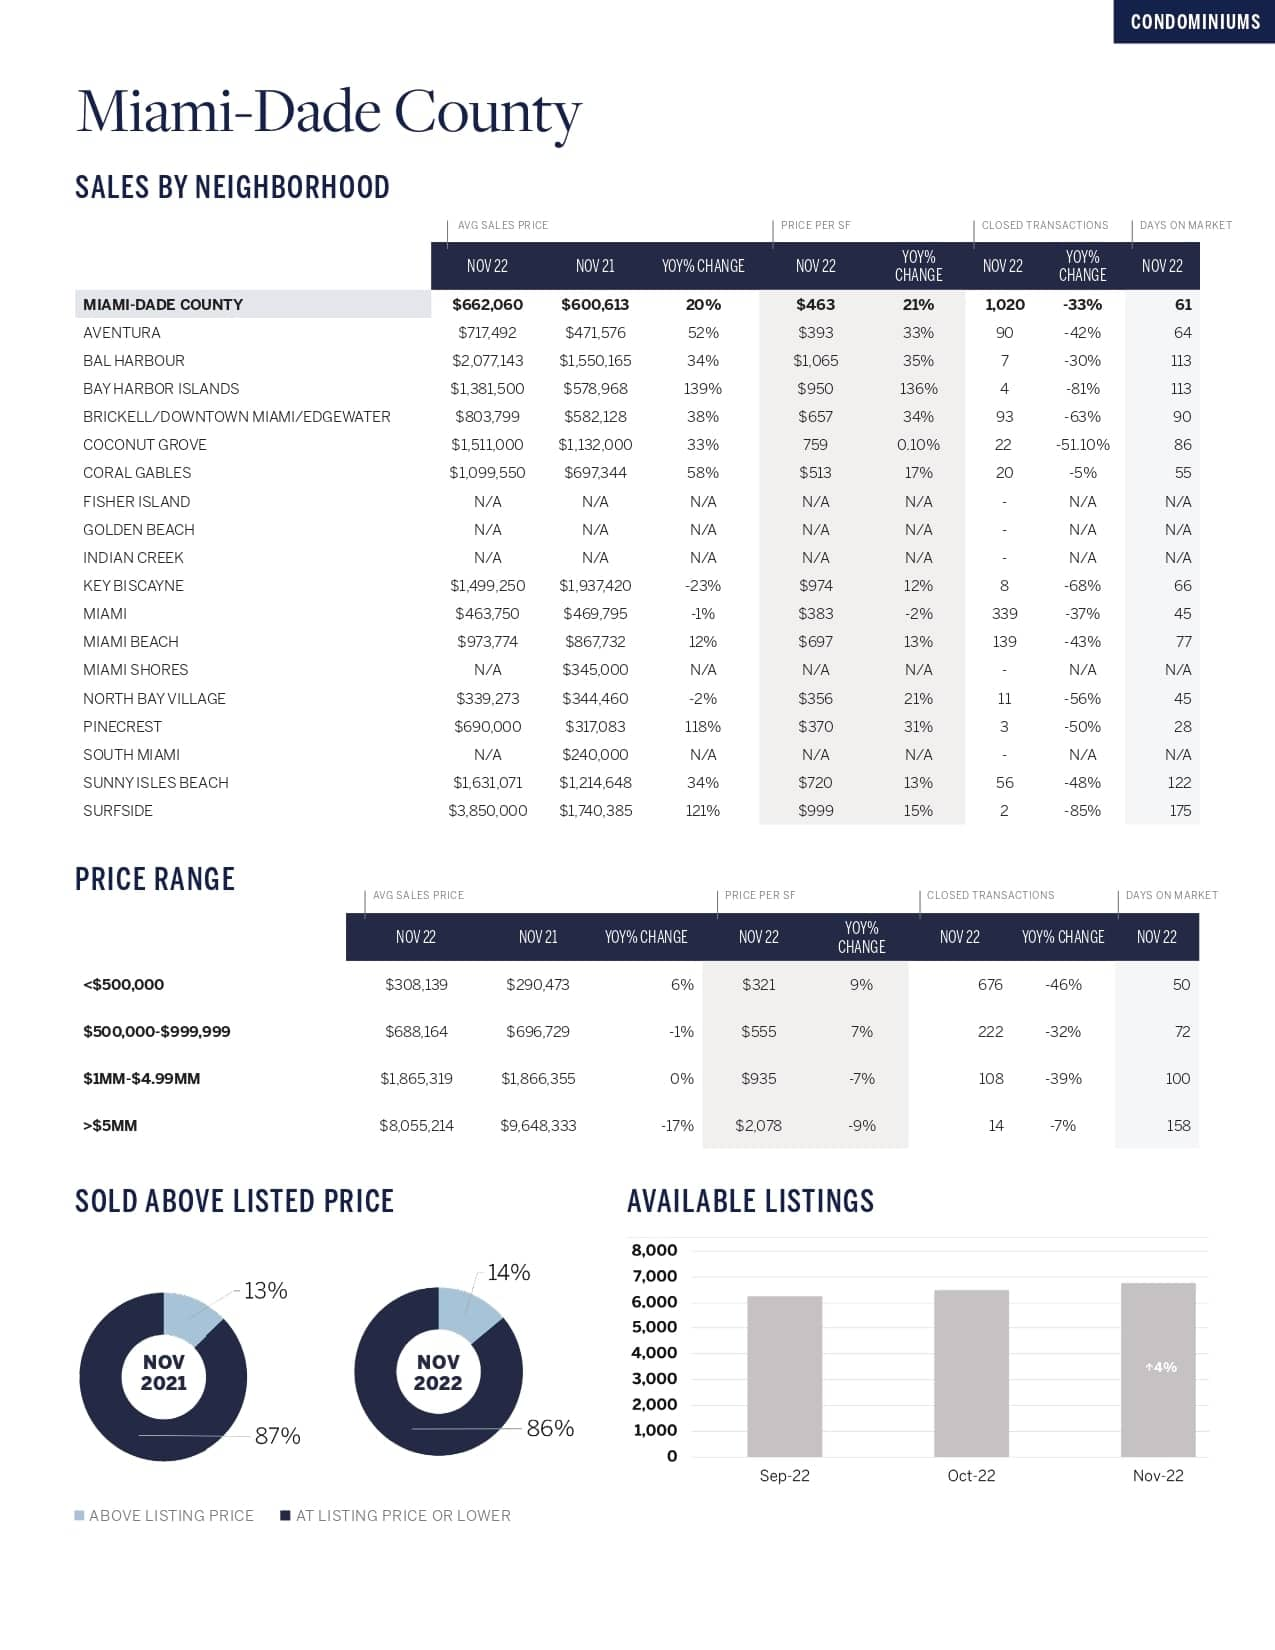
Miami-Dade condominium market infographic with neighborhood sales tables and charts comparing November 2022 and 2021.

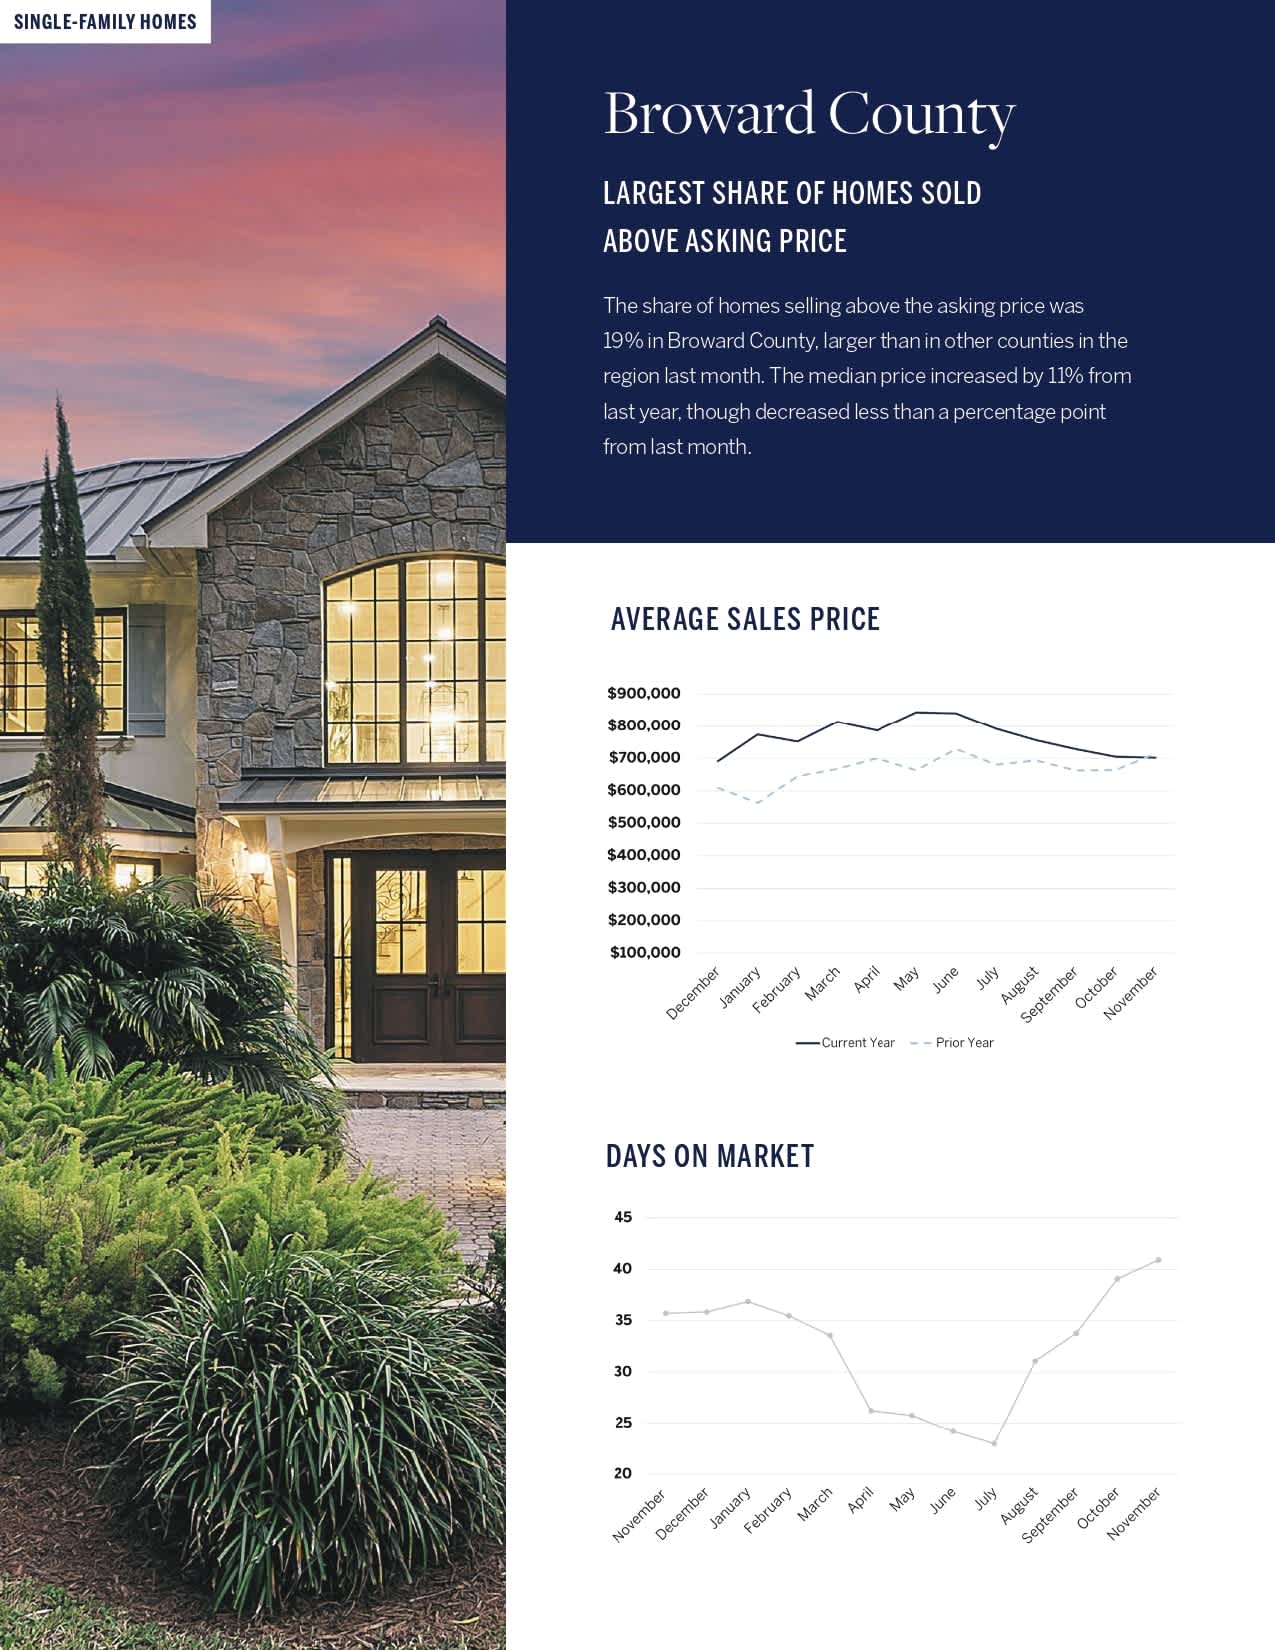
Broward County single-family home market infographic with sales price and days-on-market charts.

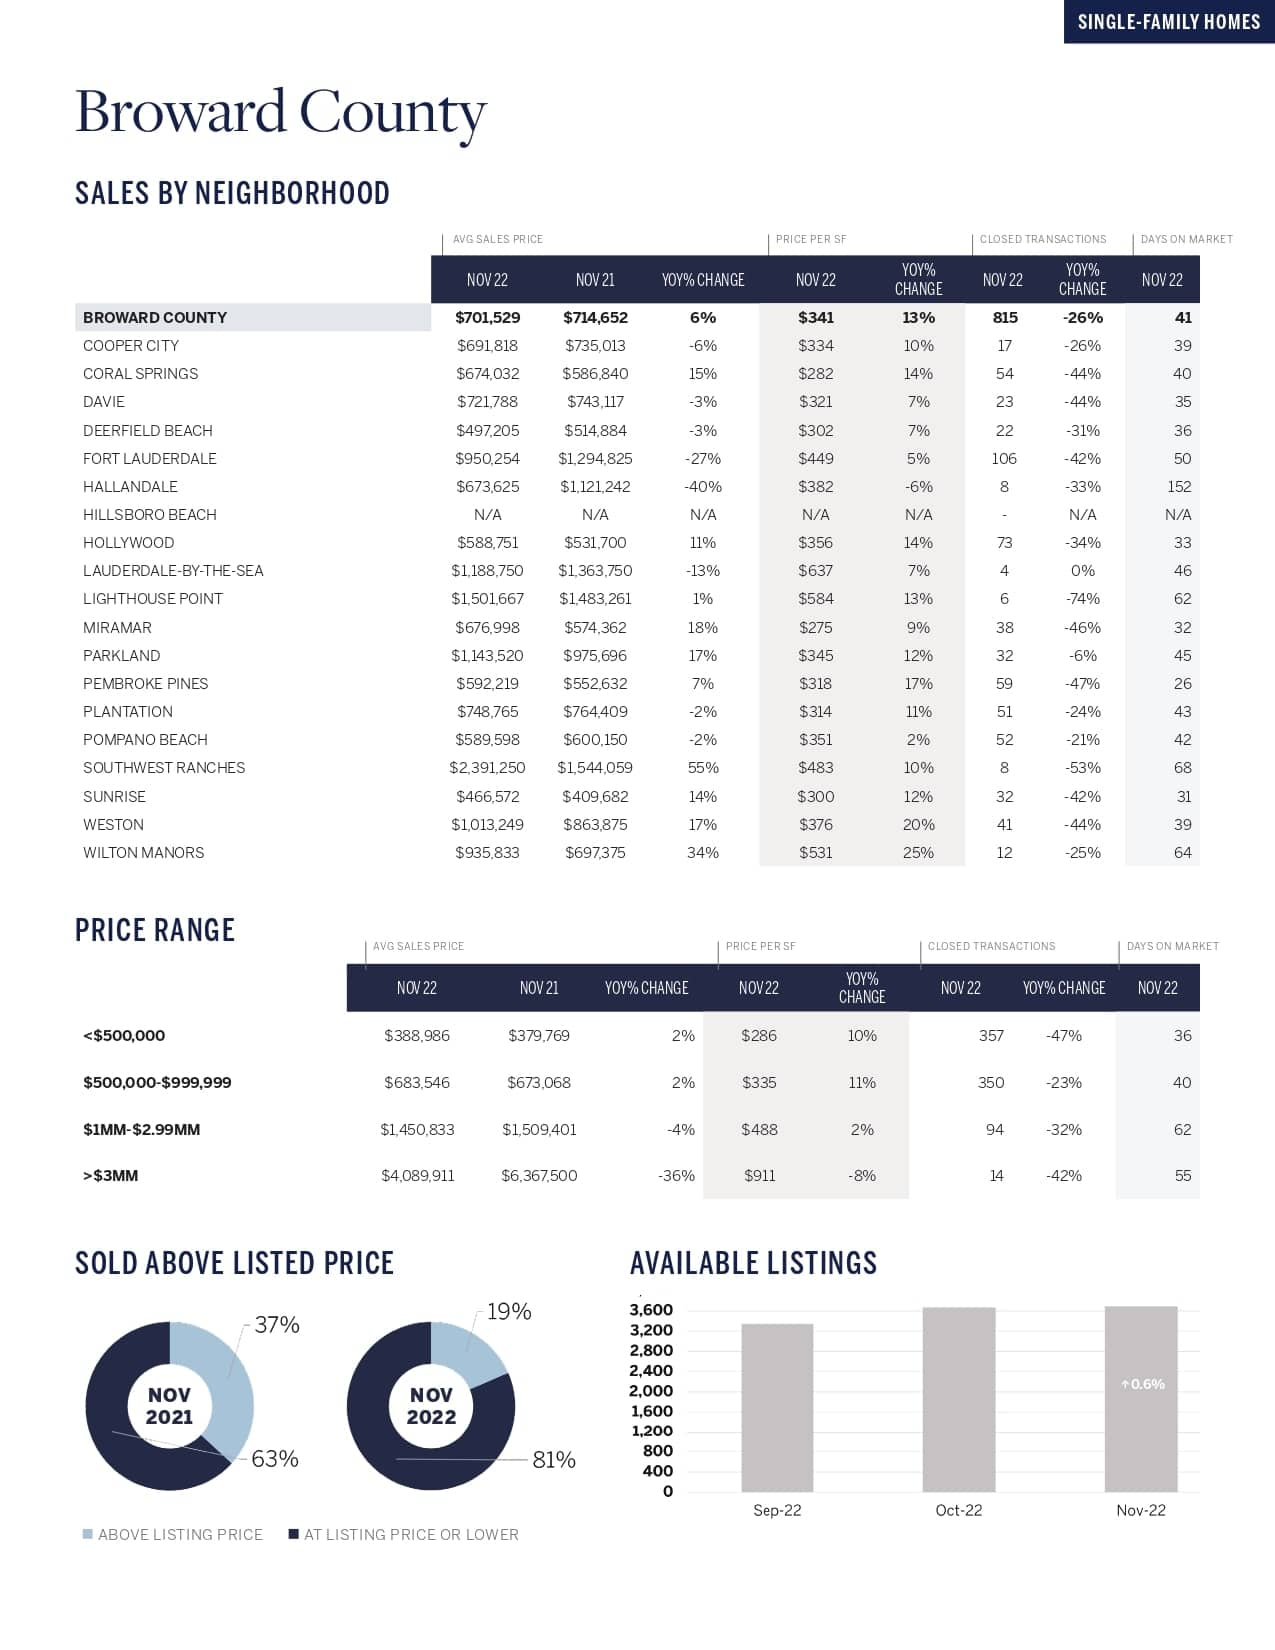
Broward County November 2022 single-family home sales infographic with neighborhood tables and market trend charts.

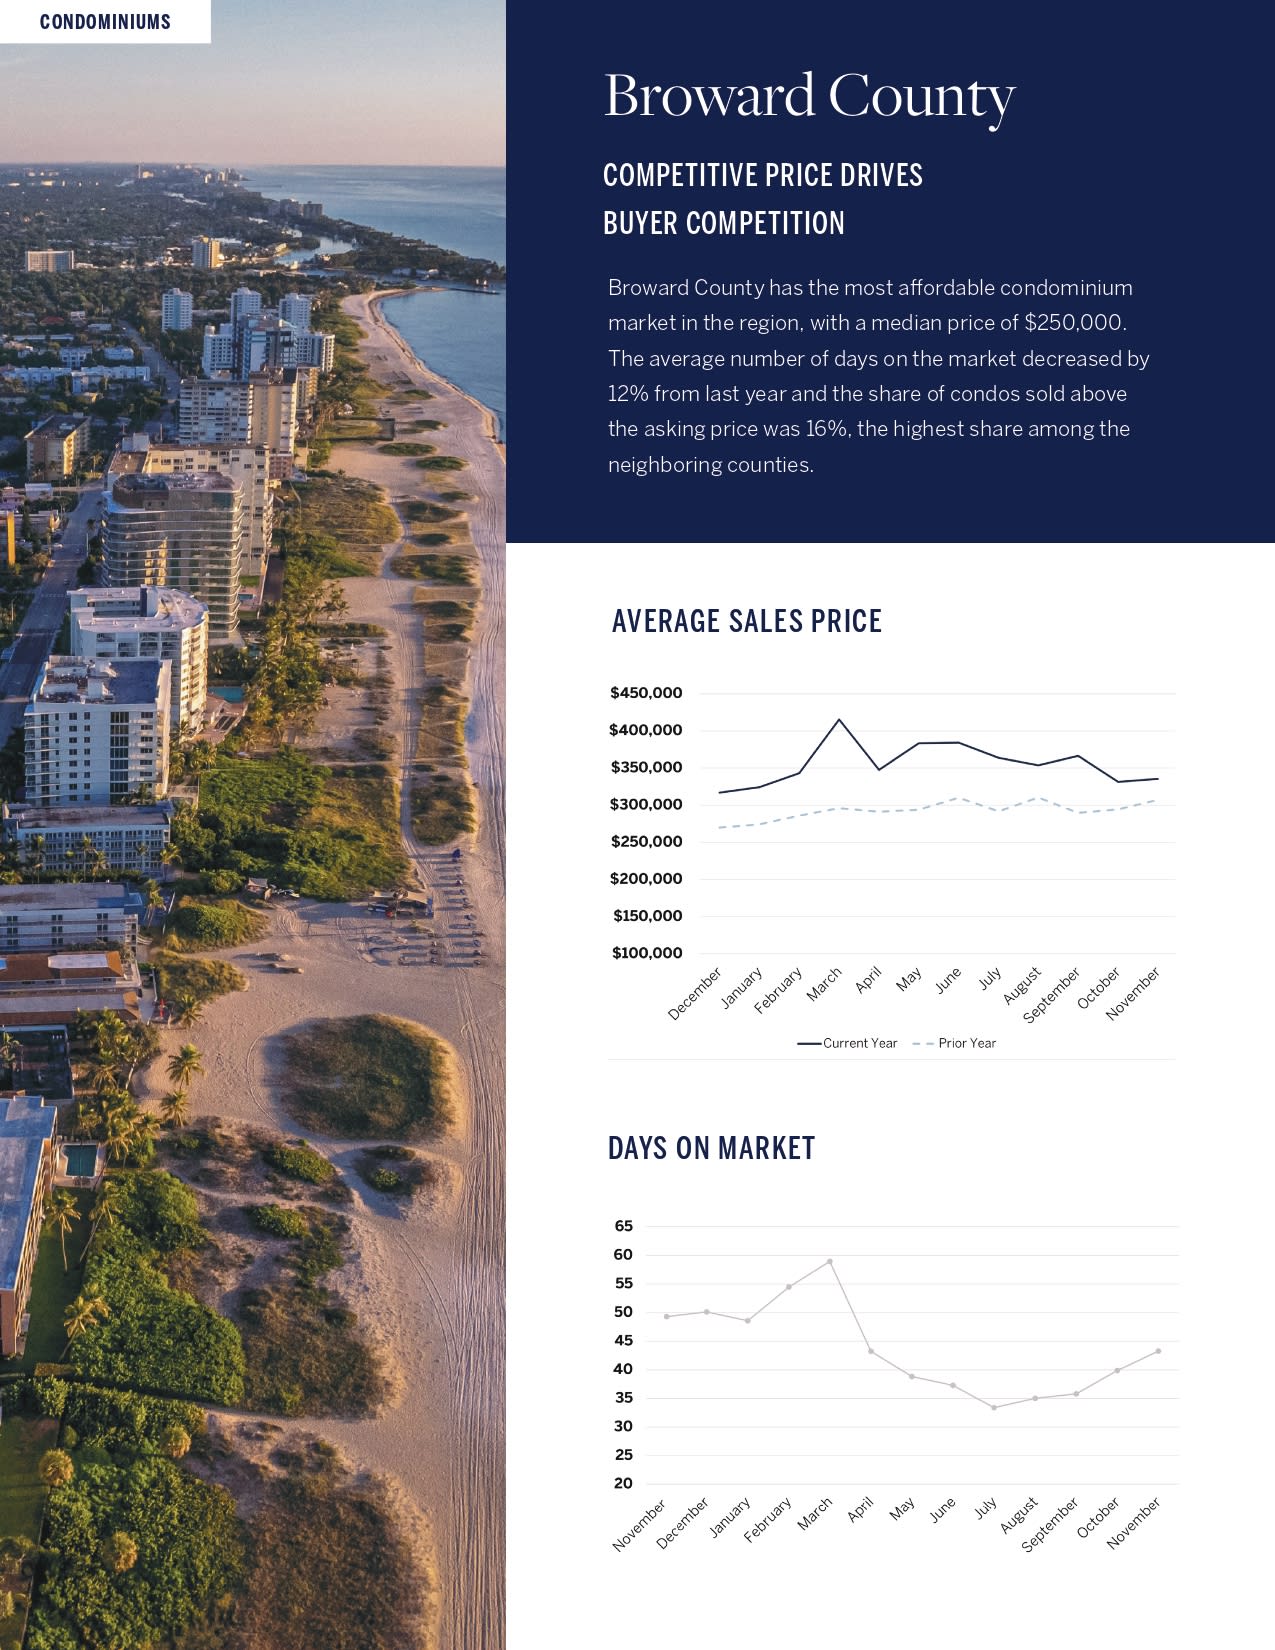
Broward County condominium market infographic with a beachfront aerial photo and sales-price and days-on-market charts.

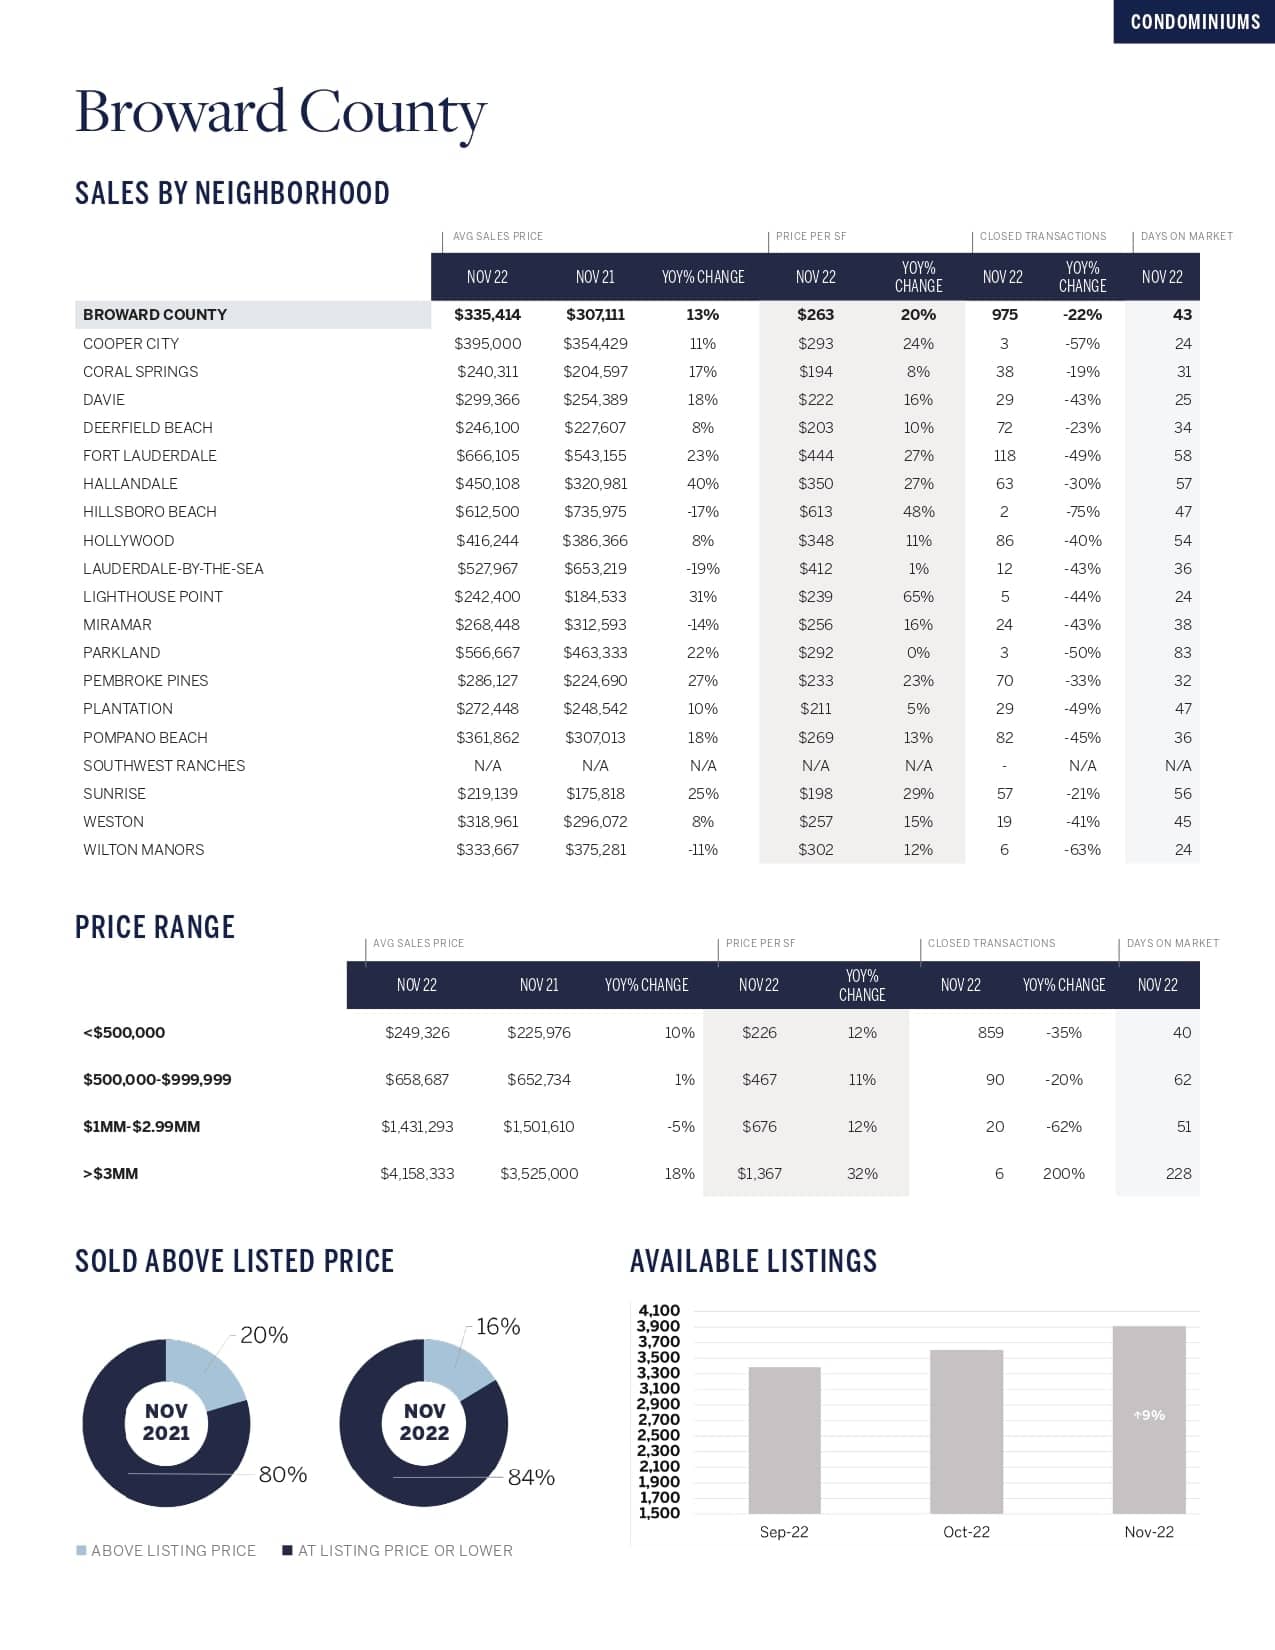
Broward County condominium market trends, with neighborhood sales tables and charts on pricing and listings.

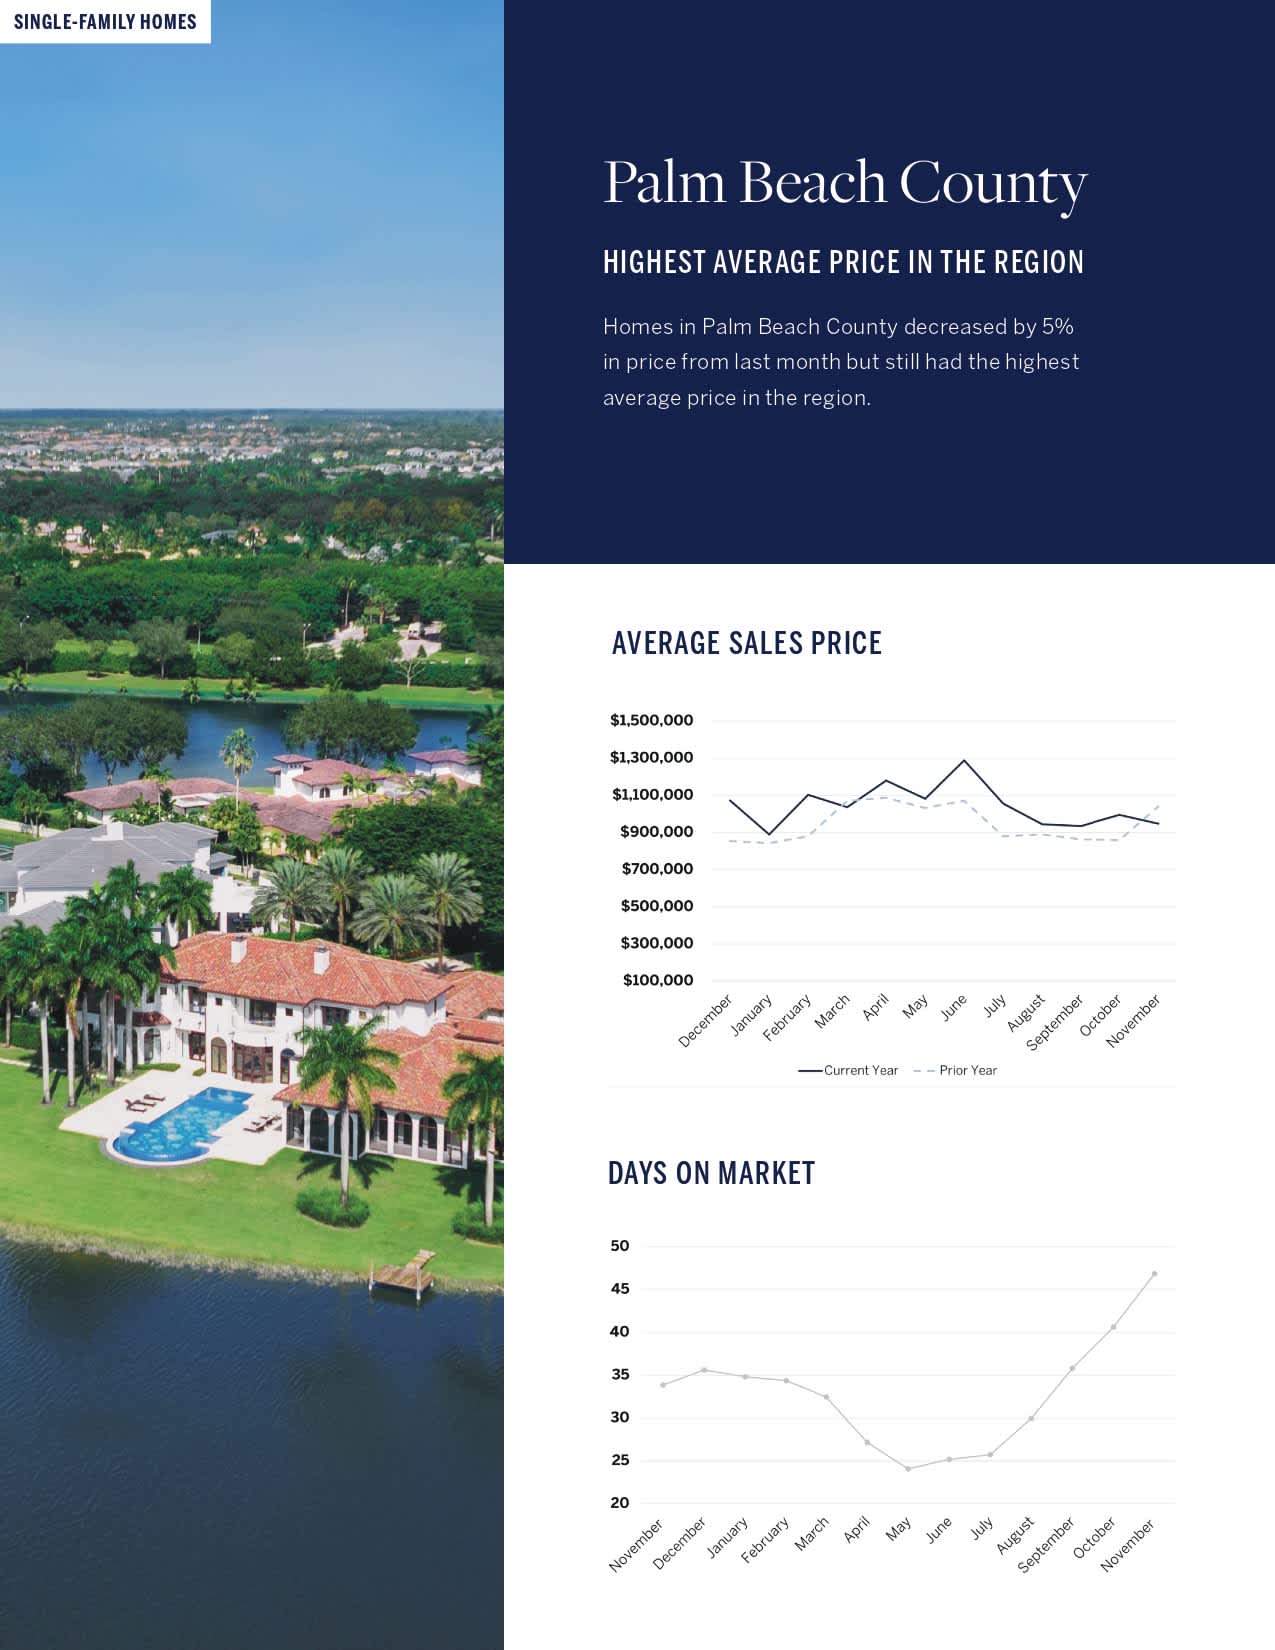
Palm Beach County single-family home market infographic with an aerial waterfront home and charts for sales prices and days on market.


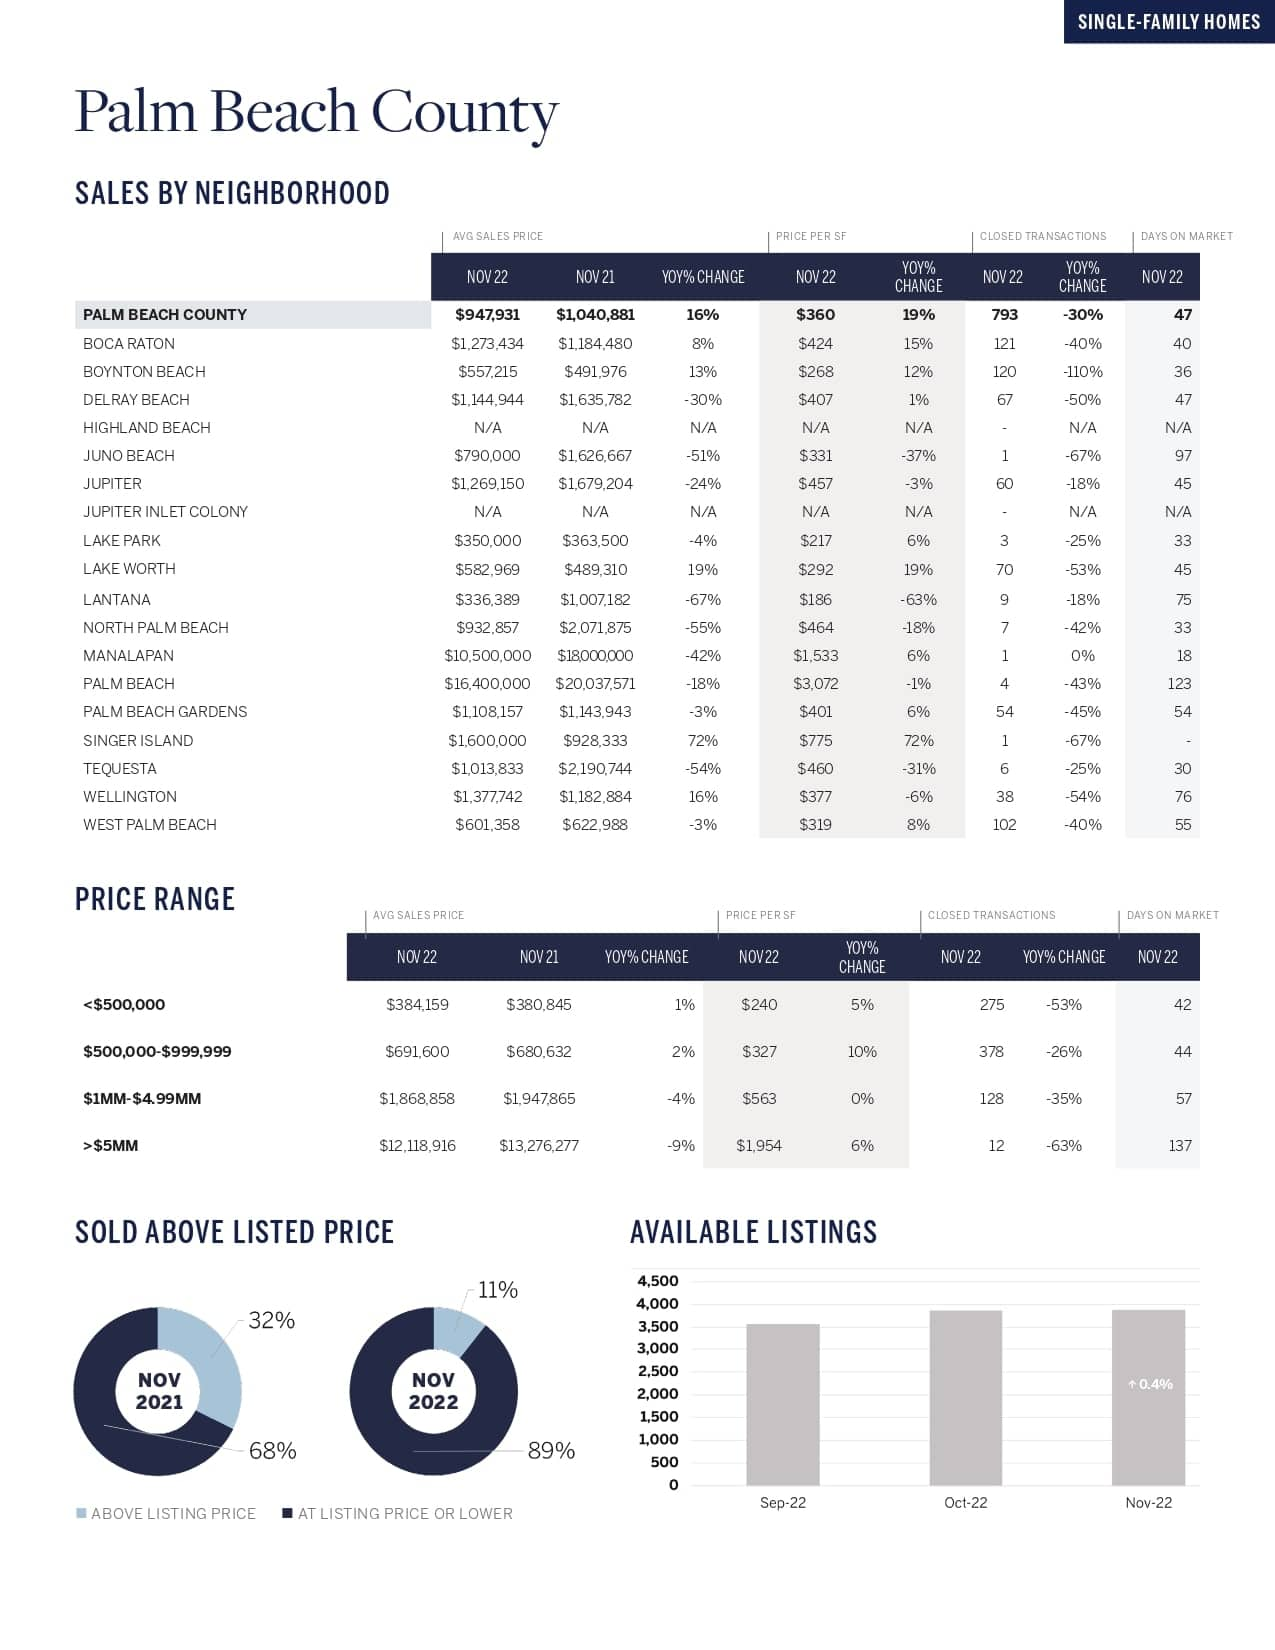
Palm Beach County November 2022 housing market trends infographic with neighborhood sales tables and charts.

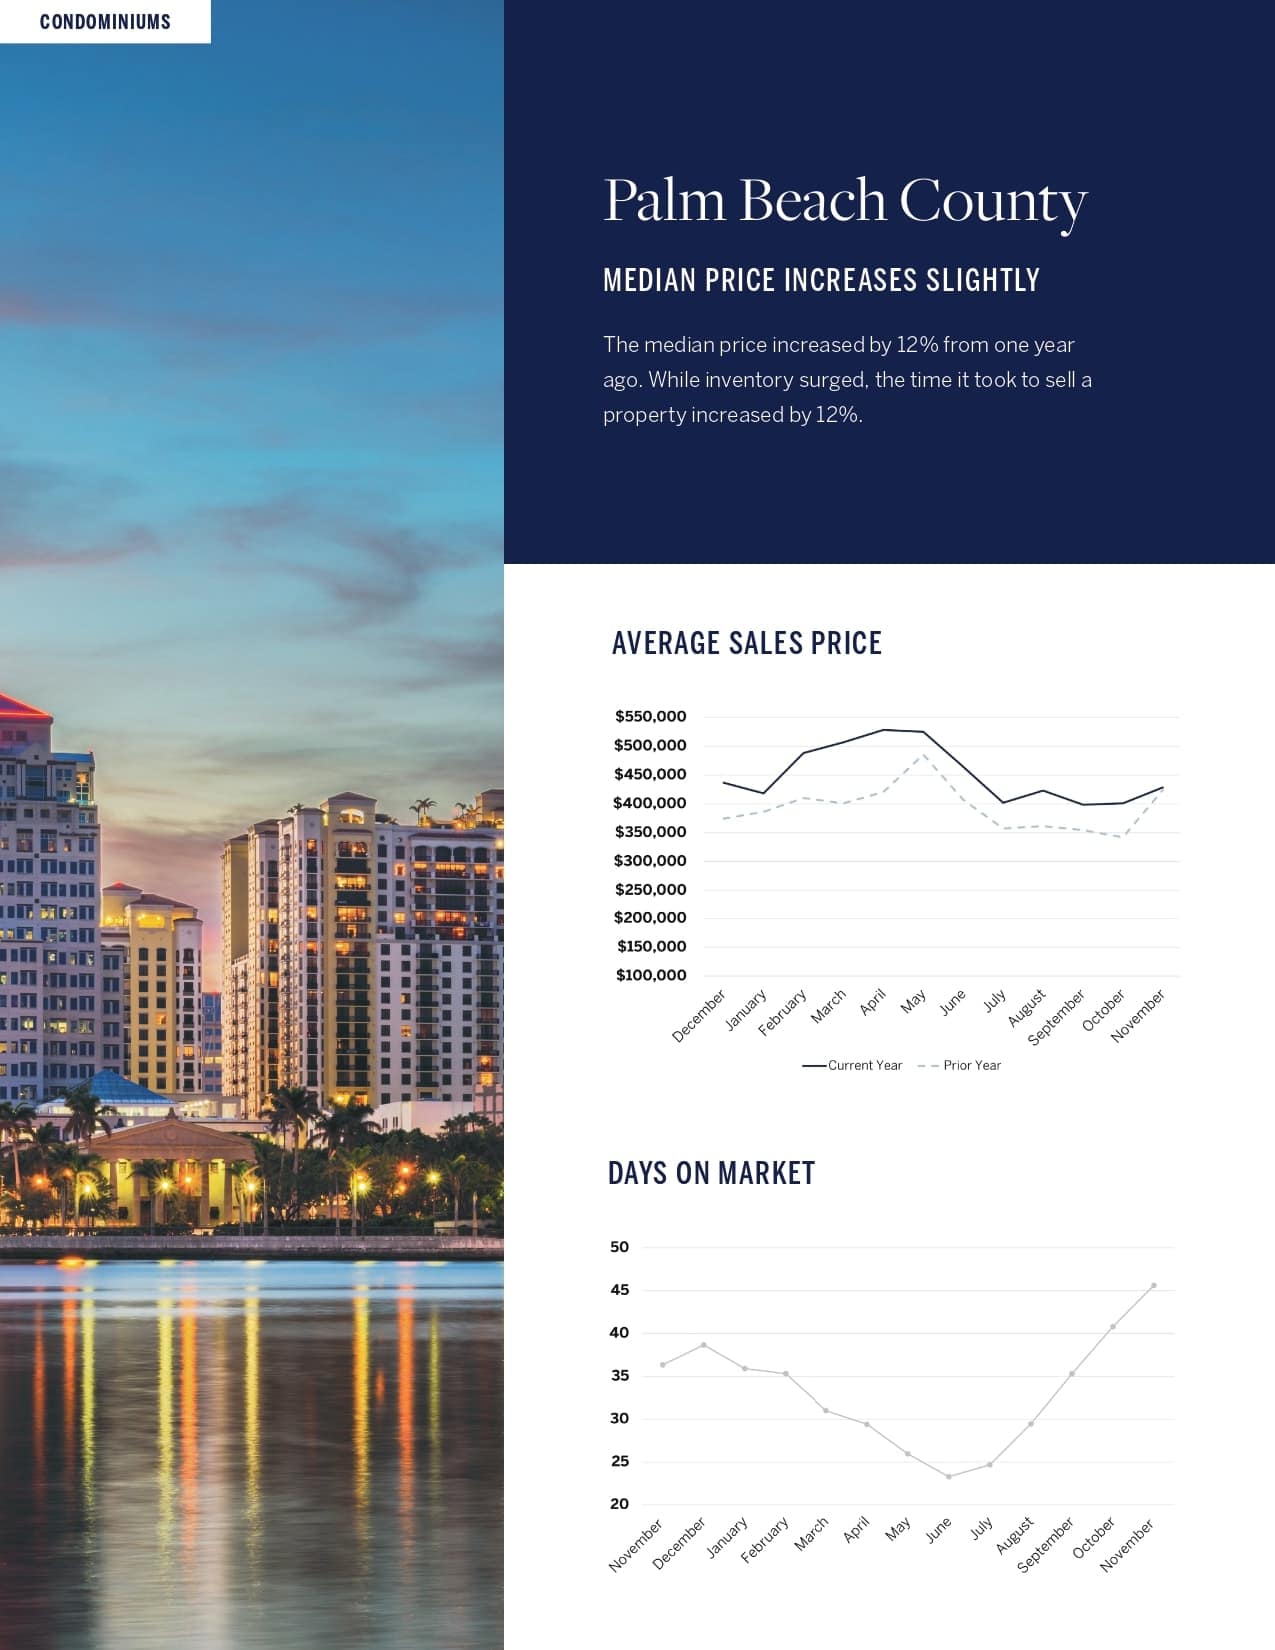
Palm Beach County condominium market trends infographic with a dusk skyline photo and sales charts.

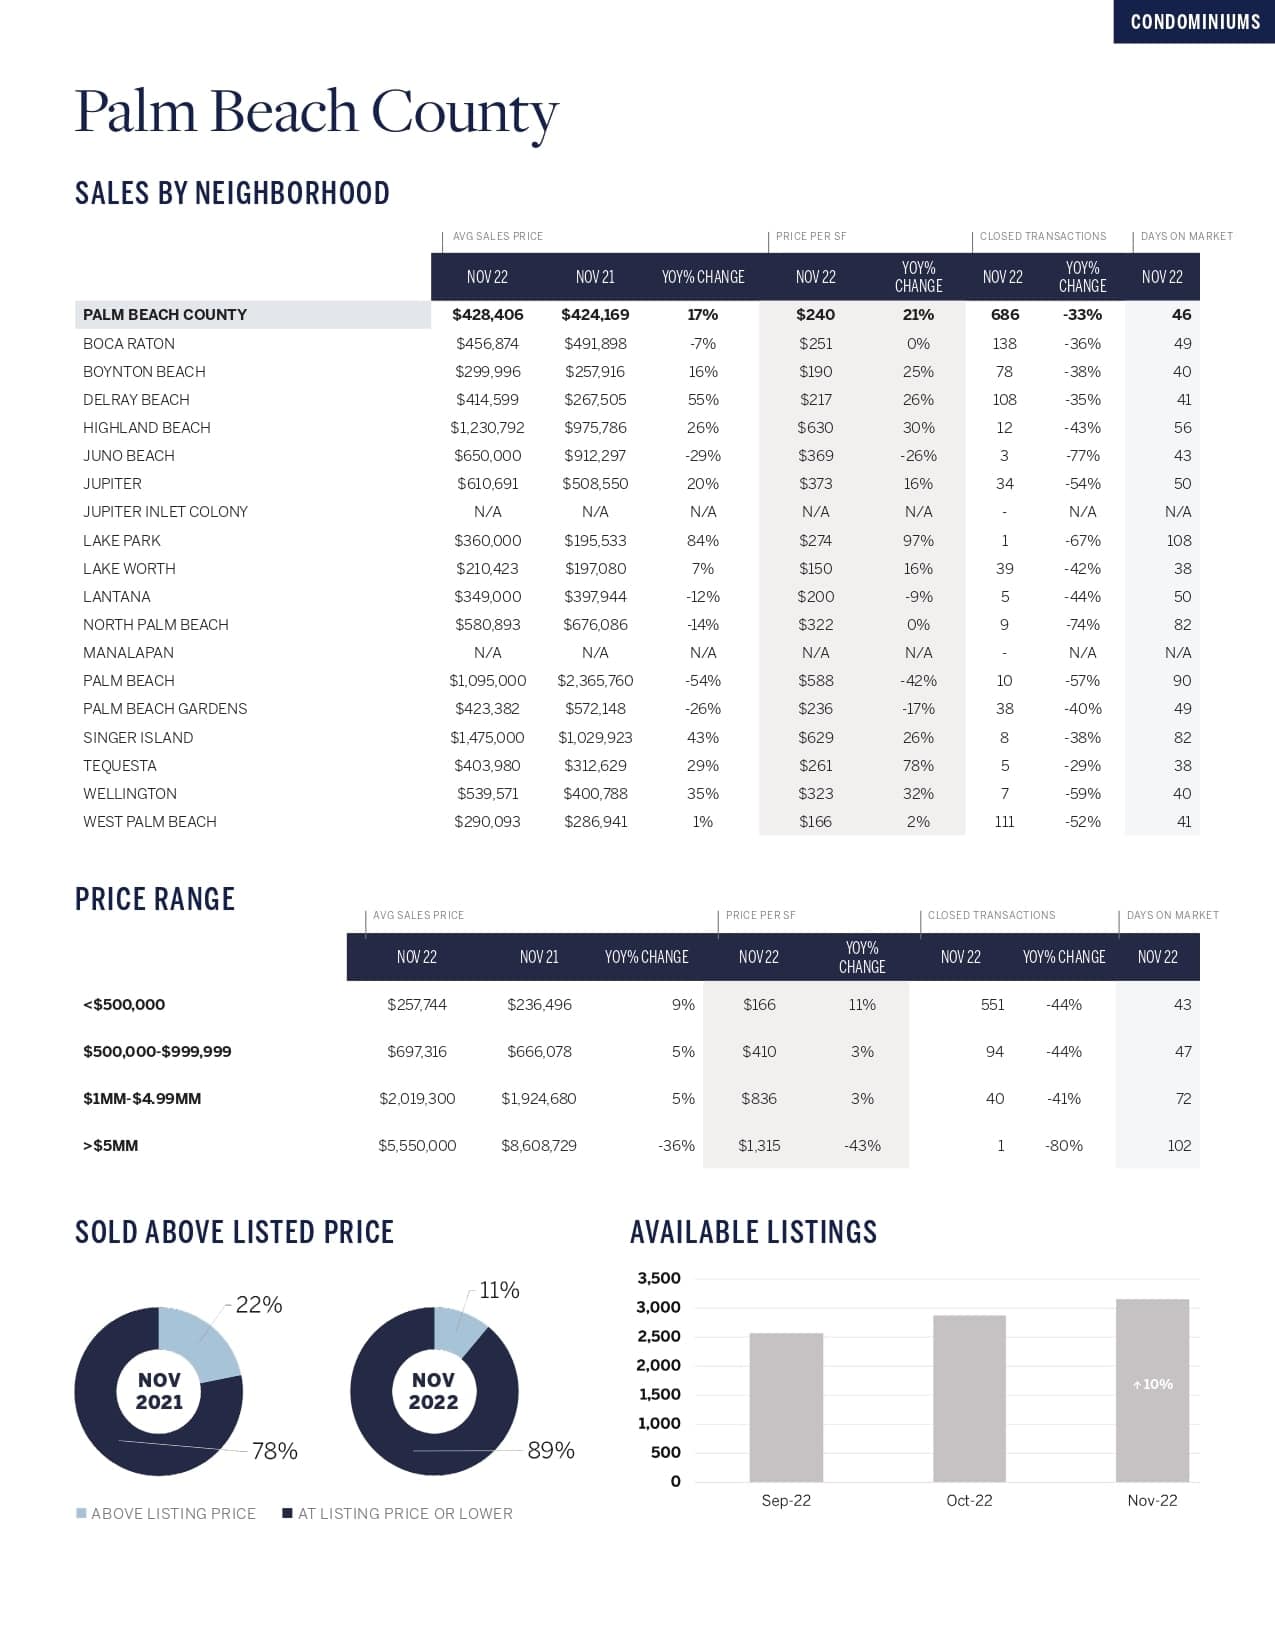
Palm Beach County condominium market infographic with neighborhood sales tables and charts comparing November 2022 trends.

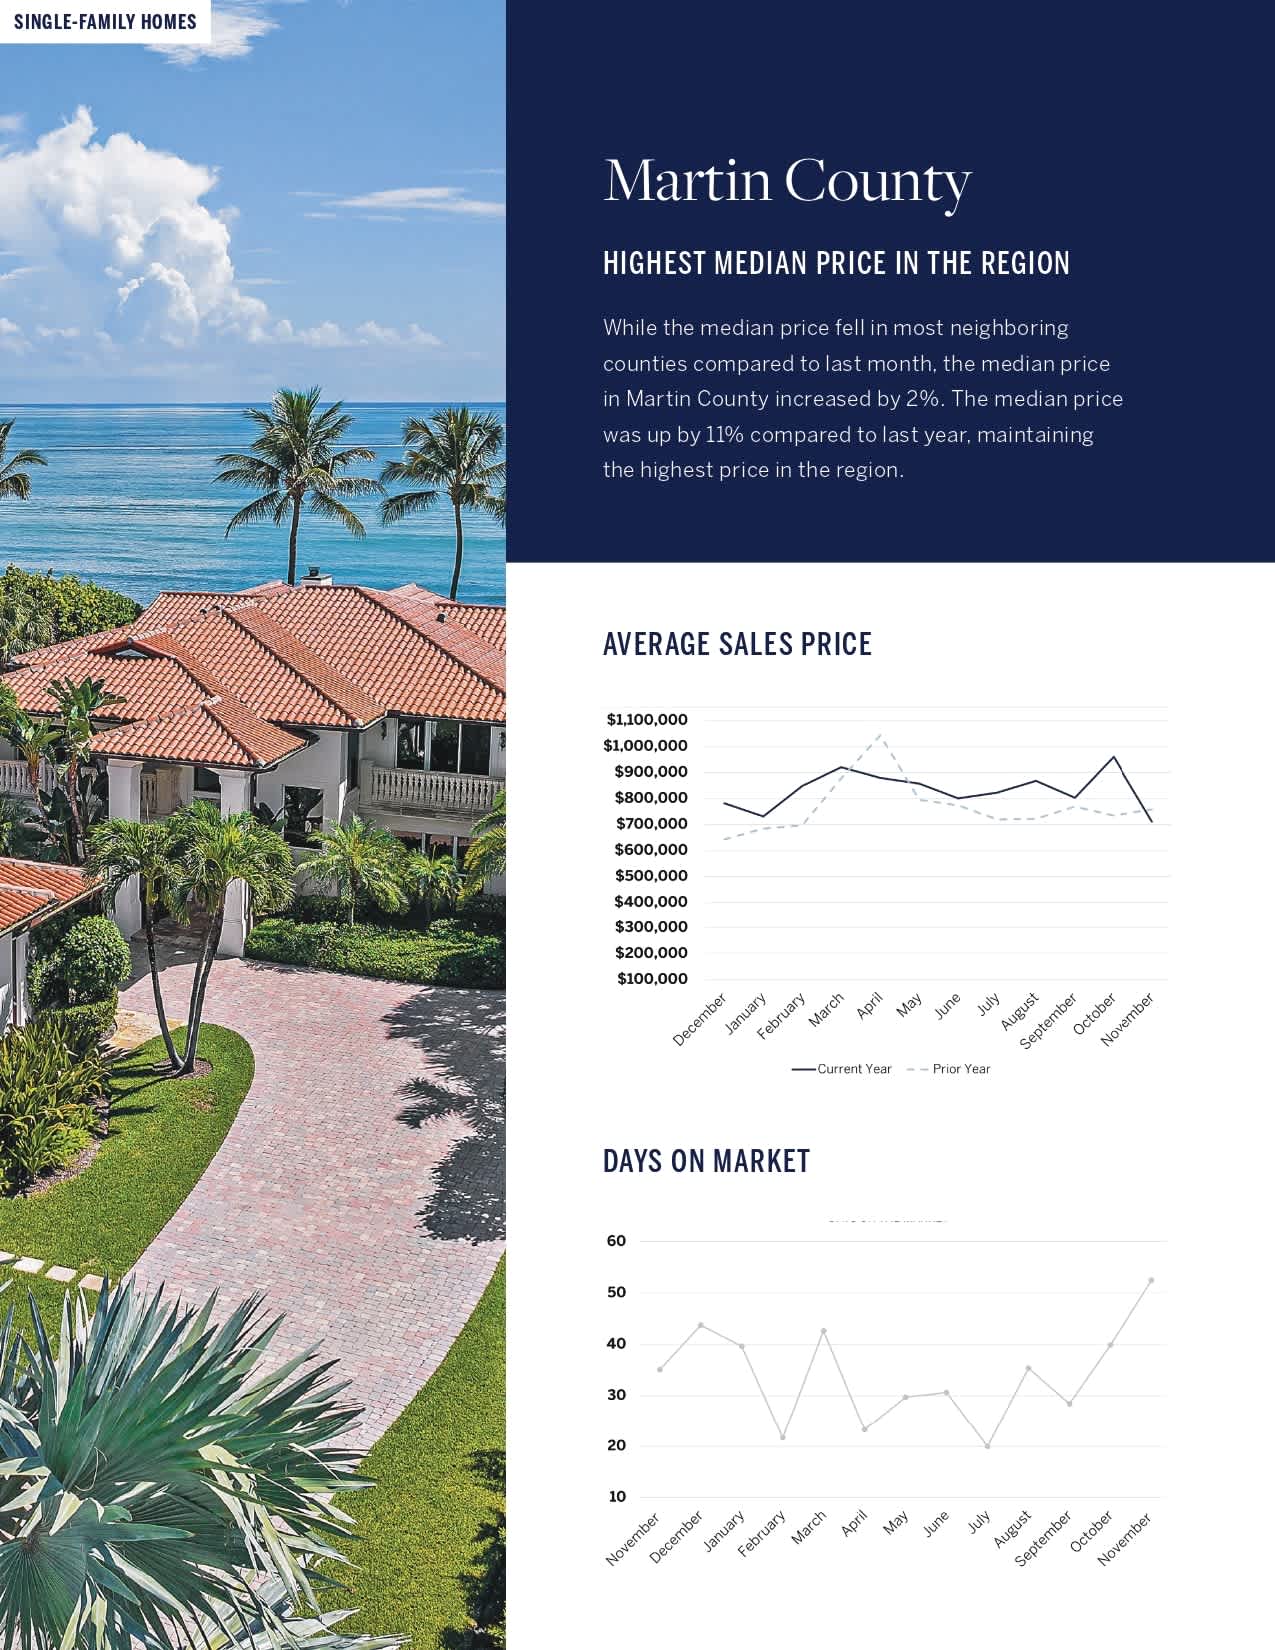
Martin County housing market infographic with oceanfront homes and charts for average sales prices and days on market.

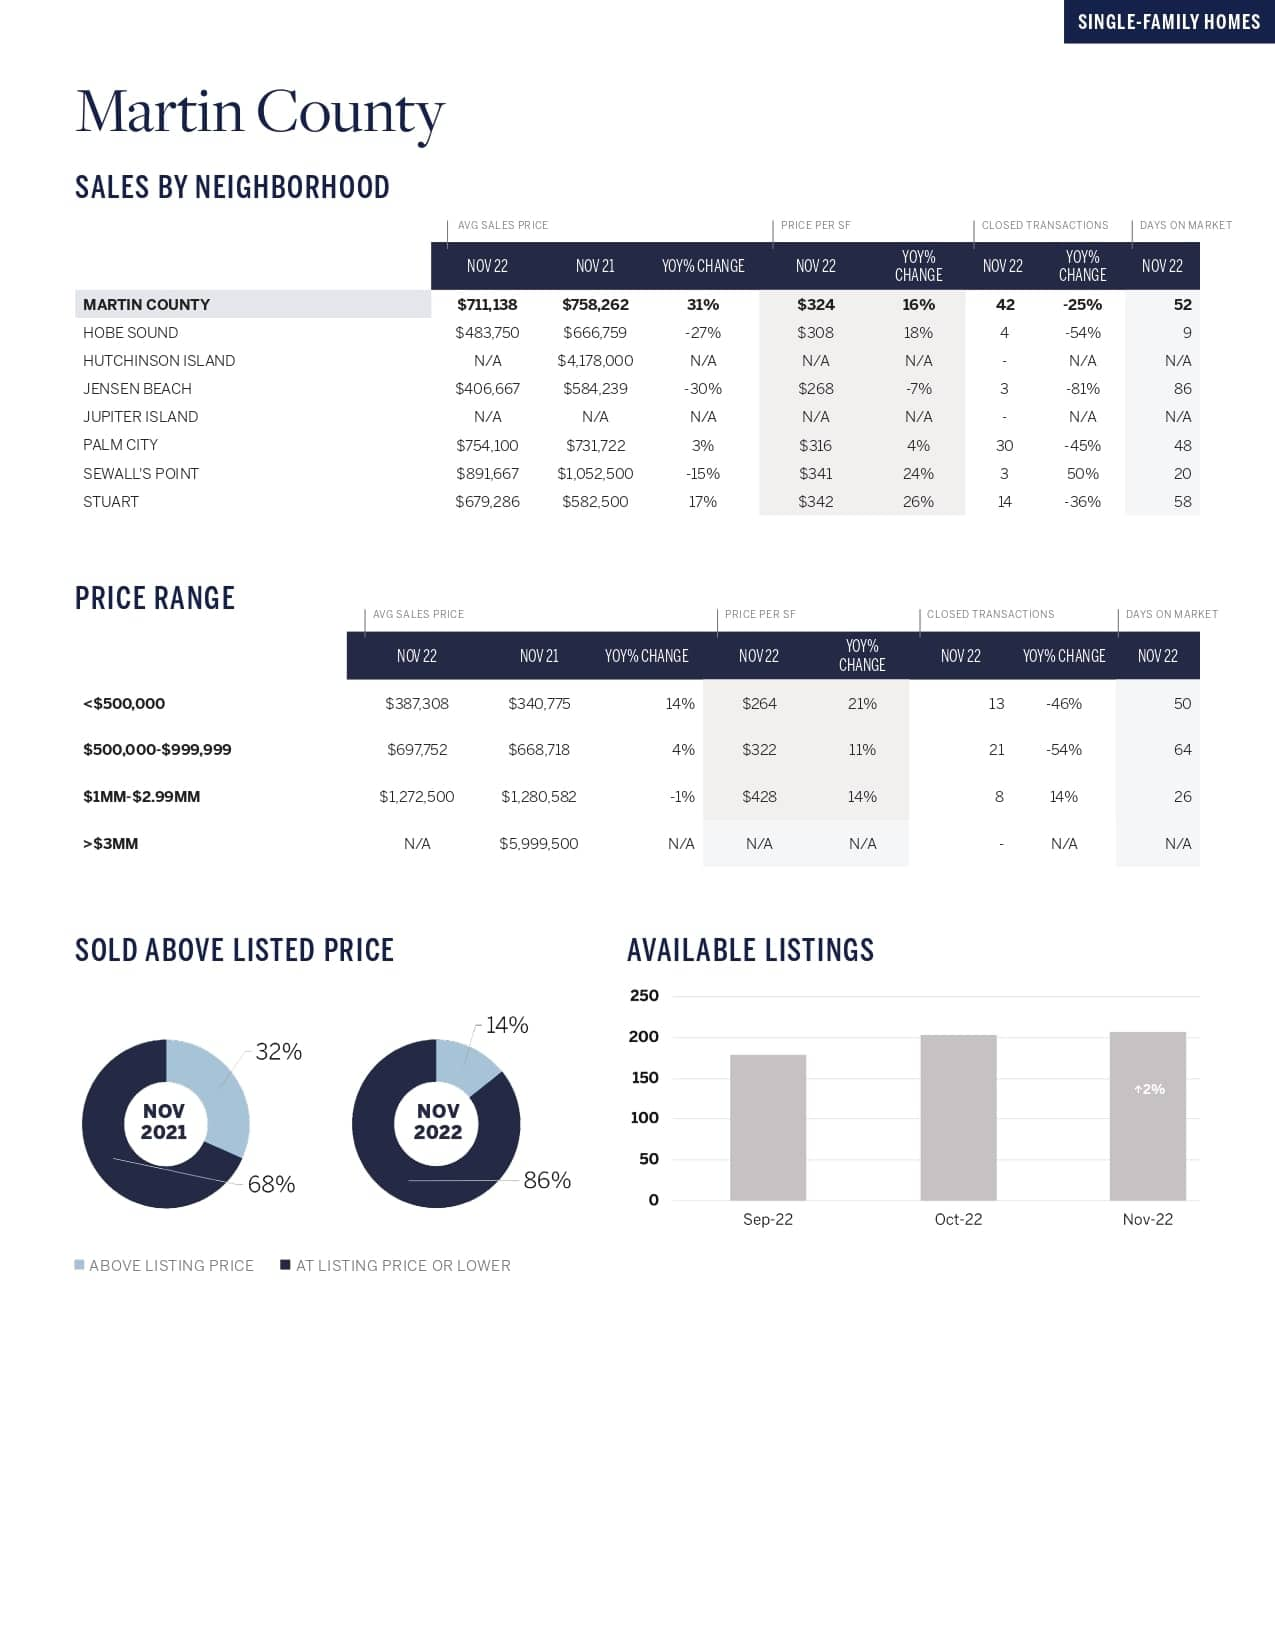
Martin County November 2022 housing trends infographic with neighborhood sales tables, price charts, and listing data.

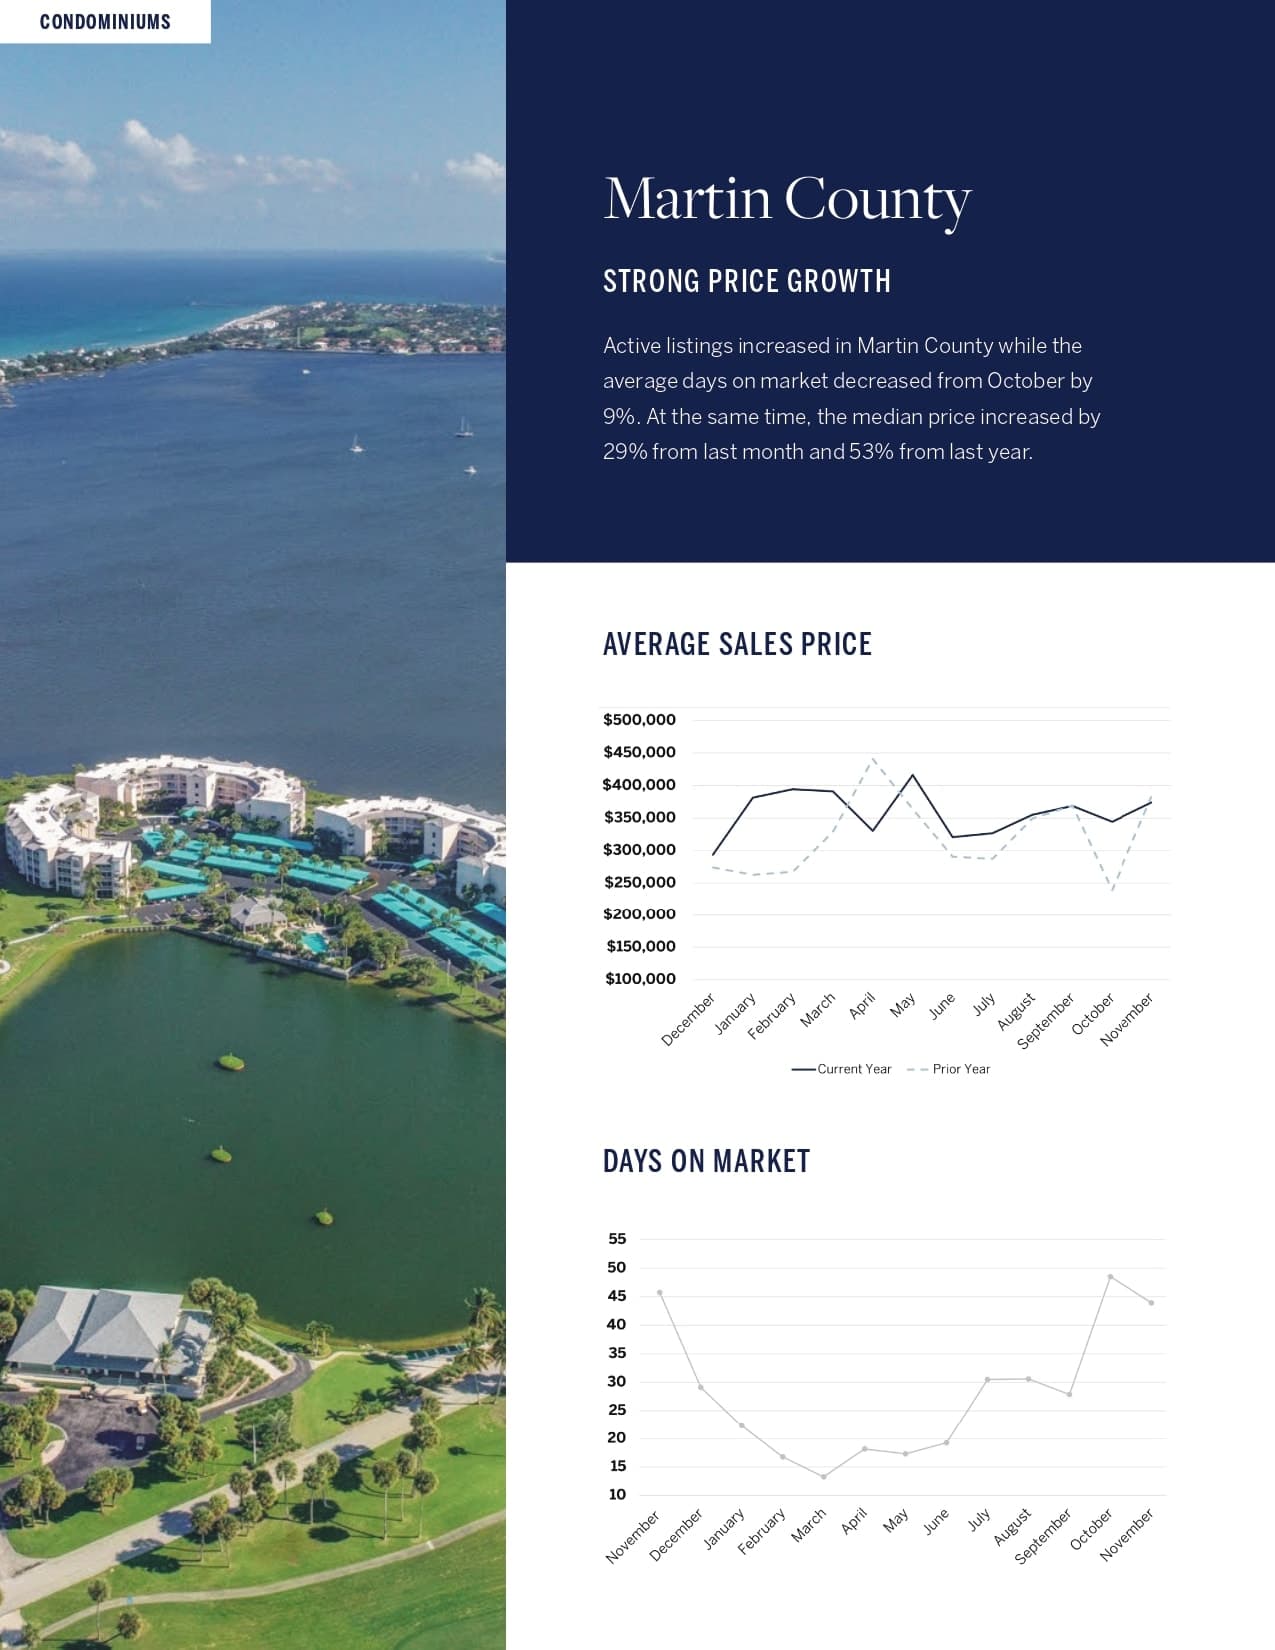
Martin County real estate trends infographic with waterfront condos and charts for sales prices and days on market.

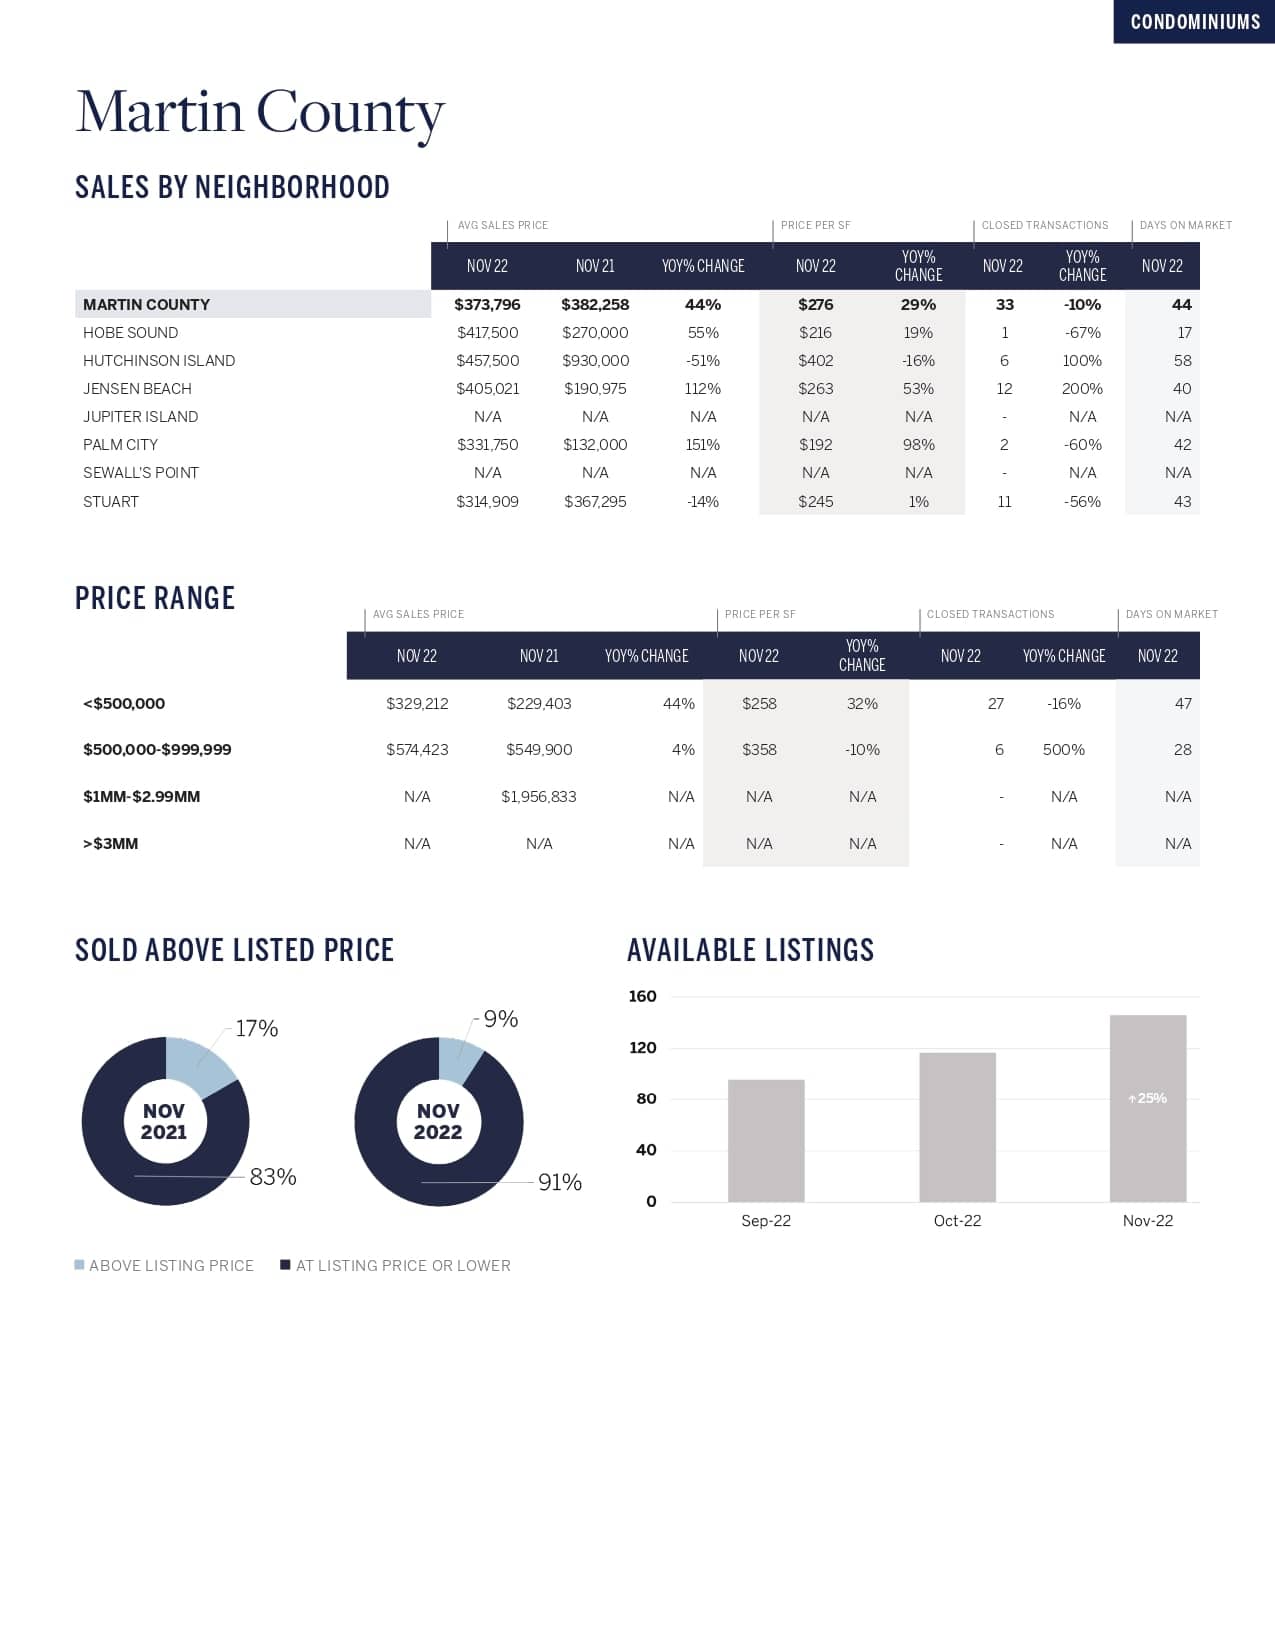
Martin County condominium market trends, with neighborhood and price-range sales tables and charts for November 2022.

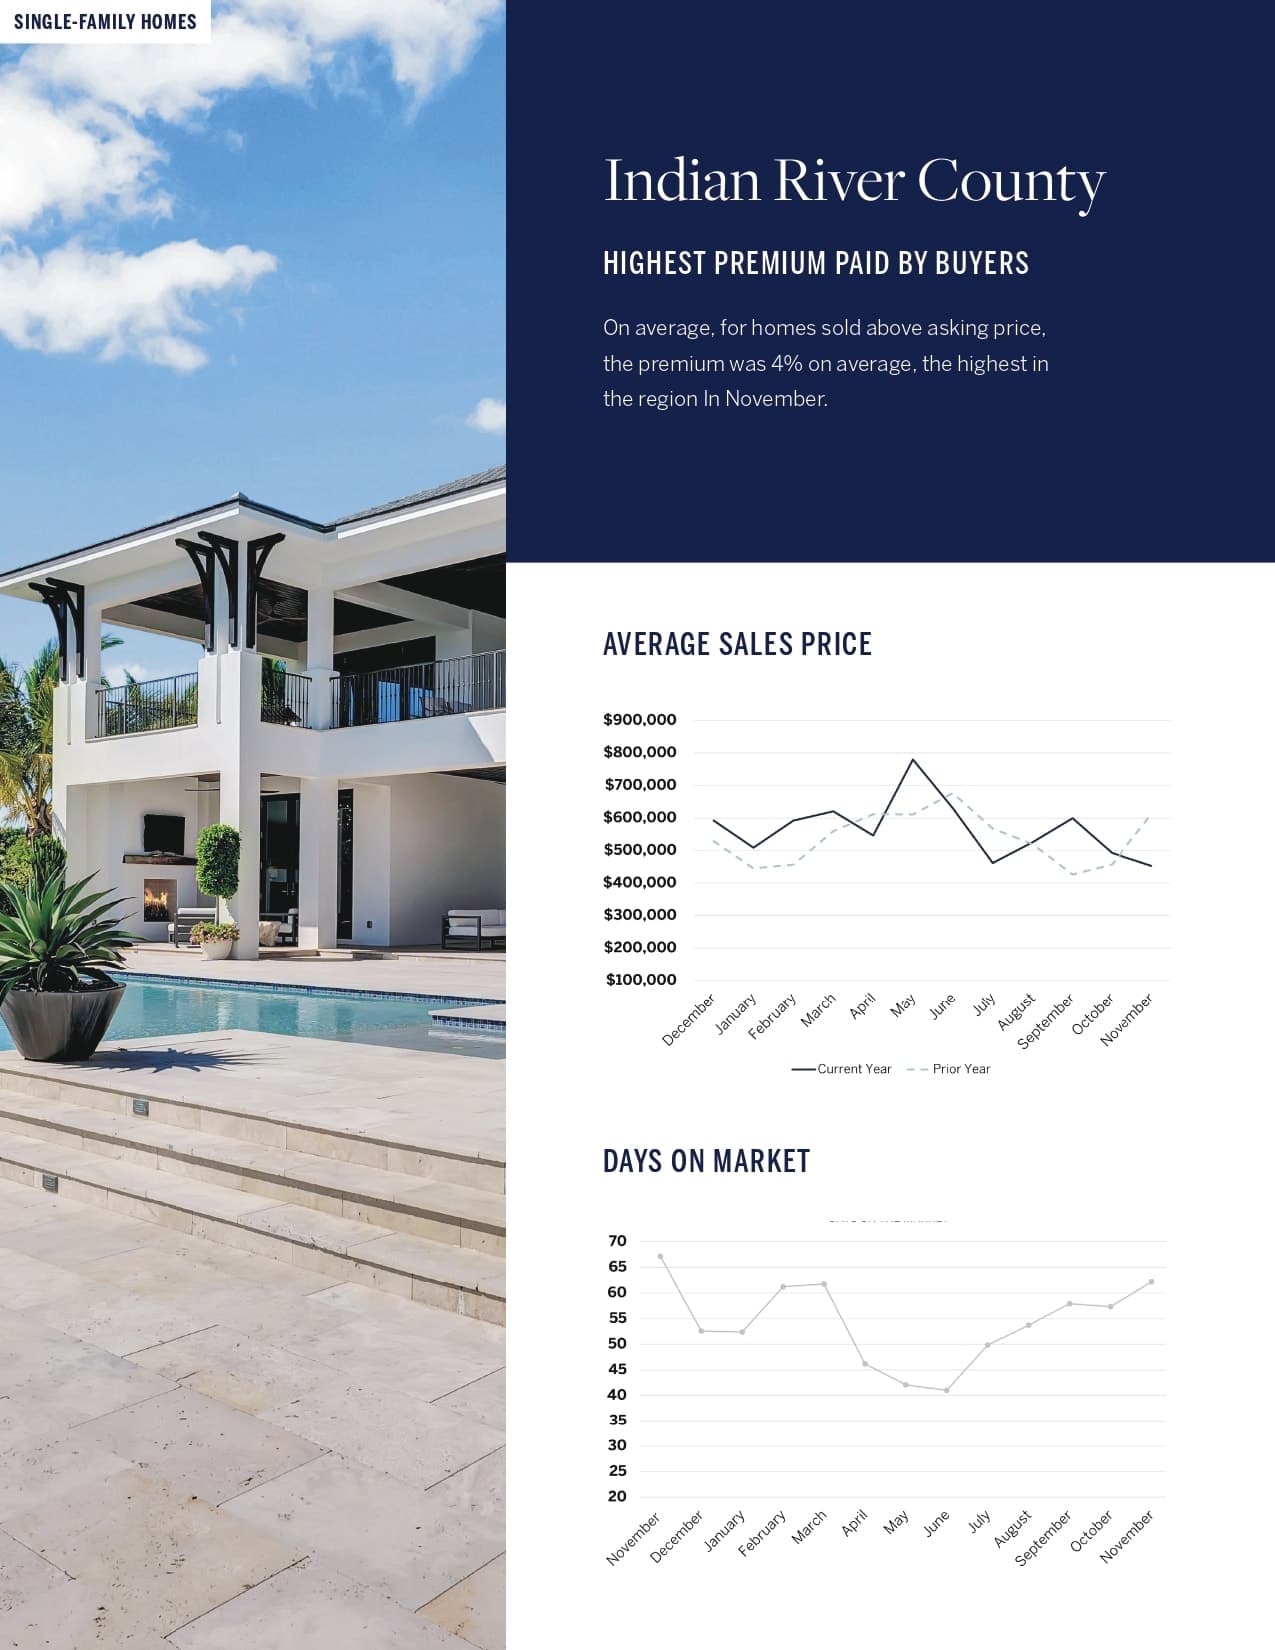
Indian River County home-market infographic: buyer premiums, average sales prices, and days on market.

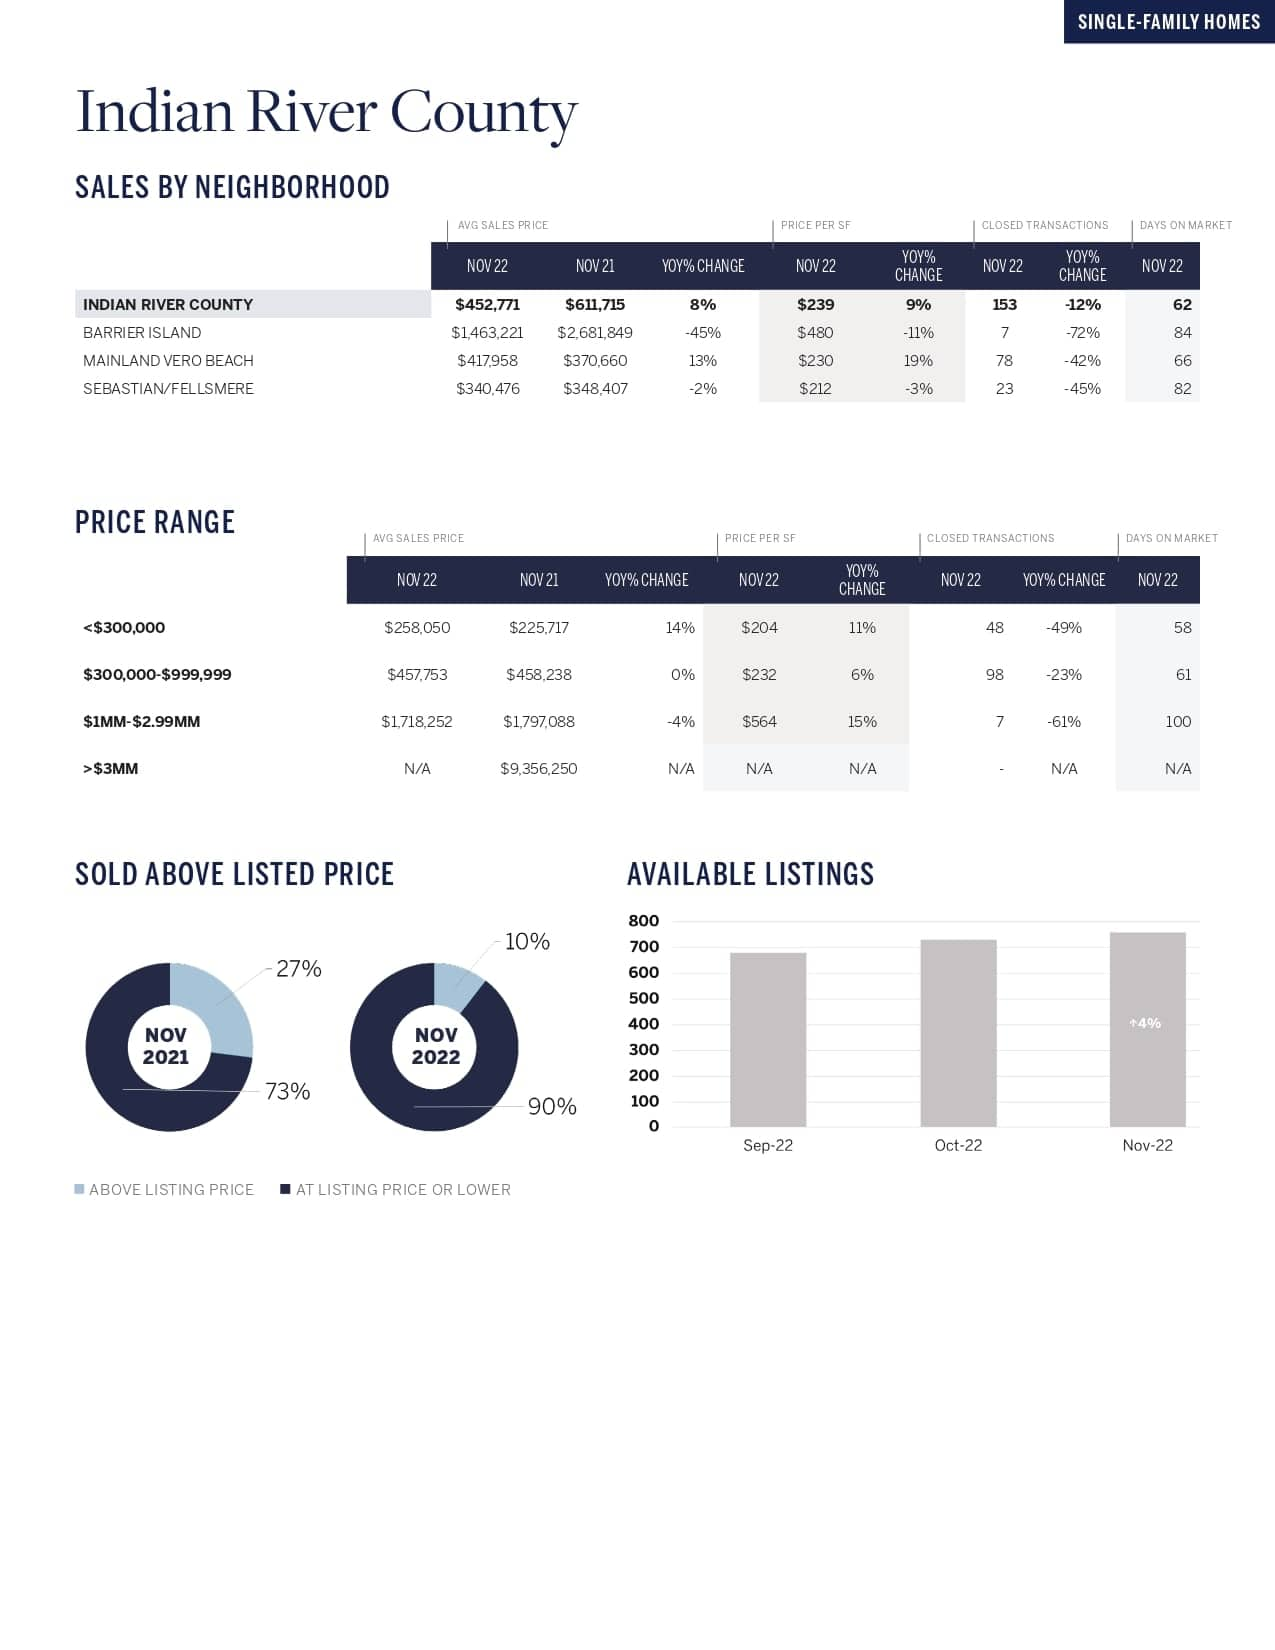
Indian River County single-family home market infographic with neighborhood sales tables and listing charts.

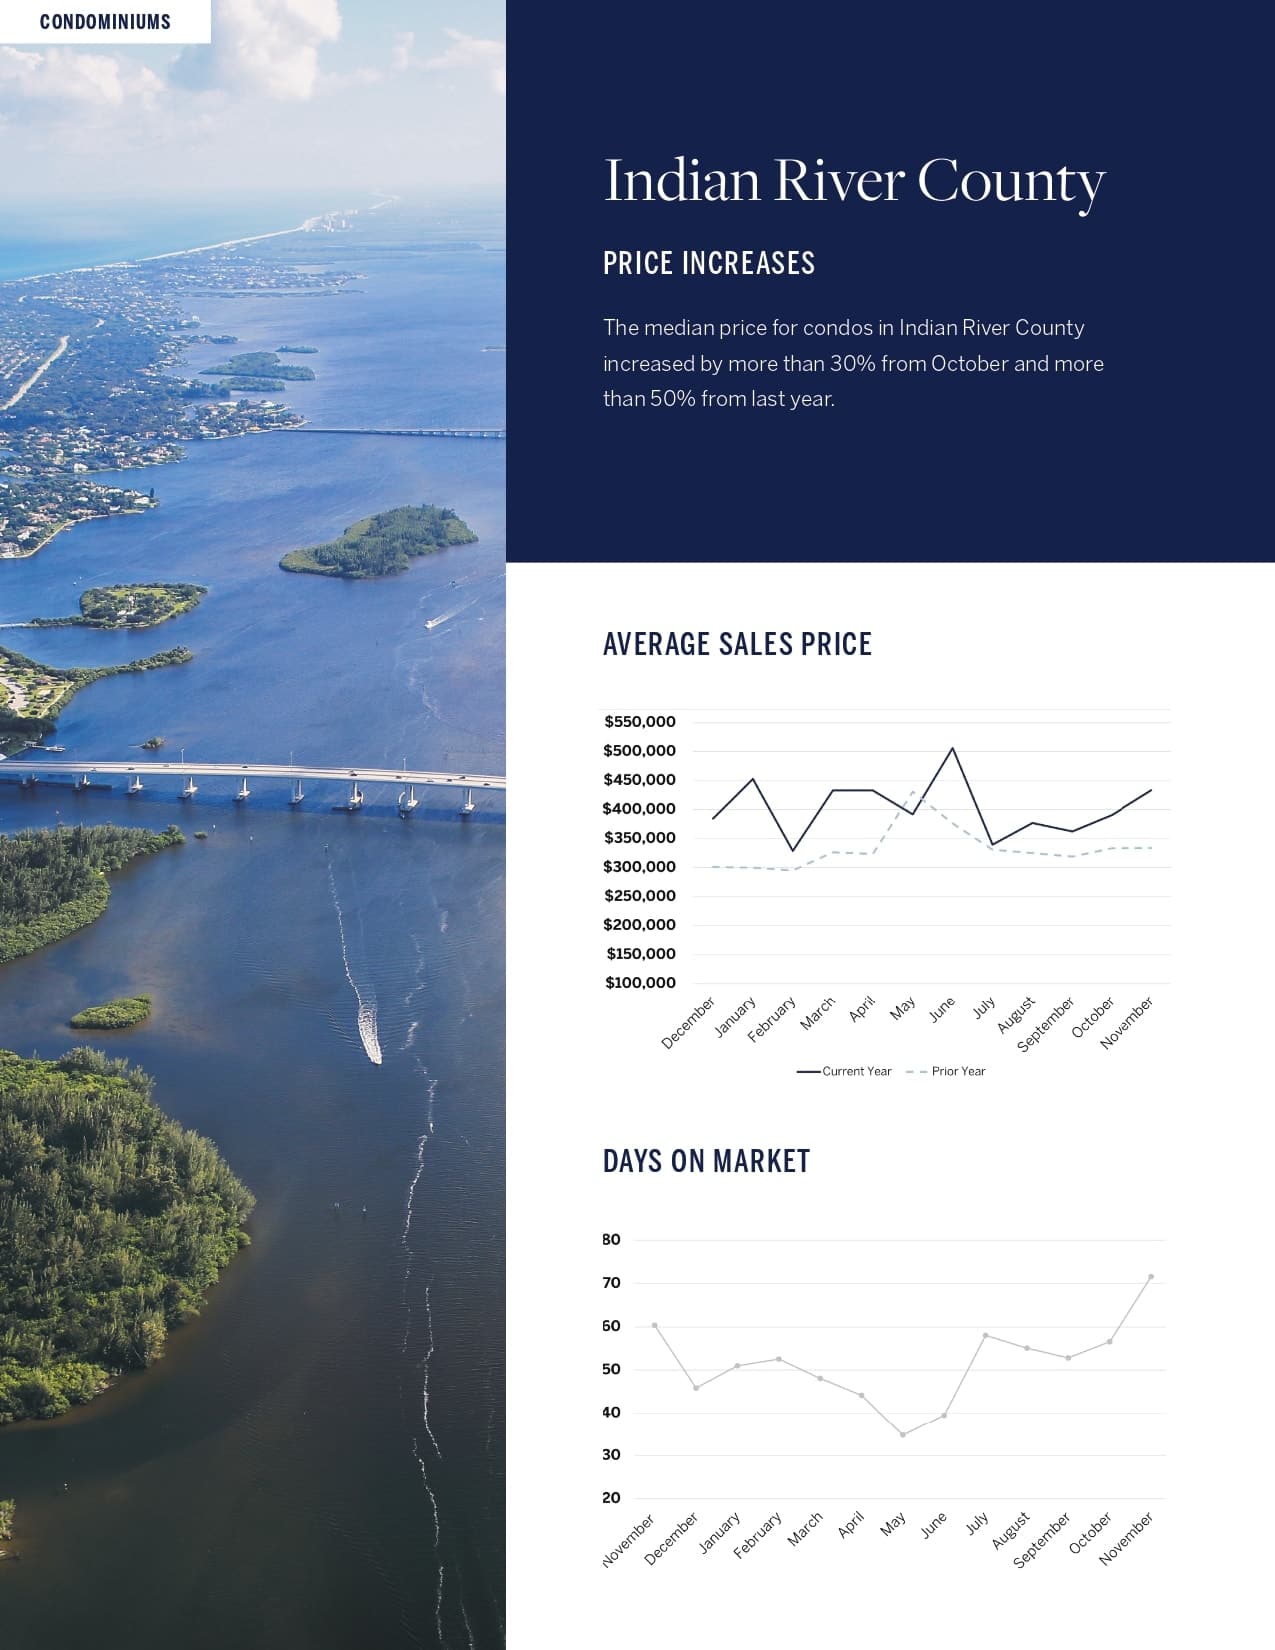
Indian River County condo market infographic with an aerial waterway photo and charts for sales prices and days on market.

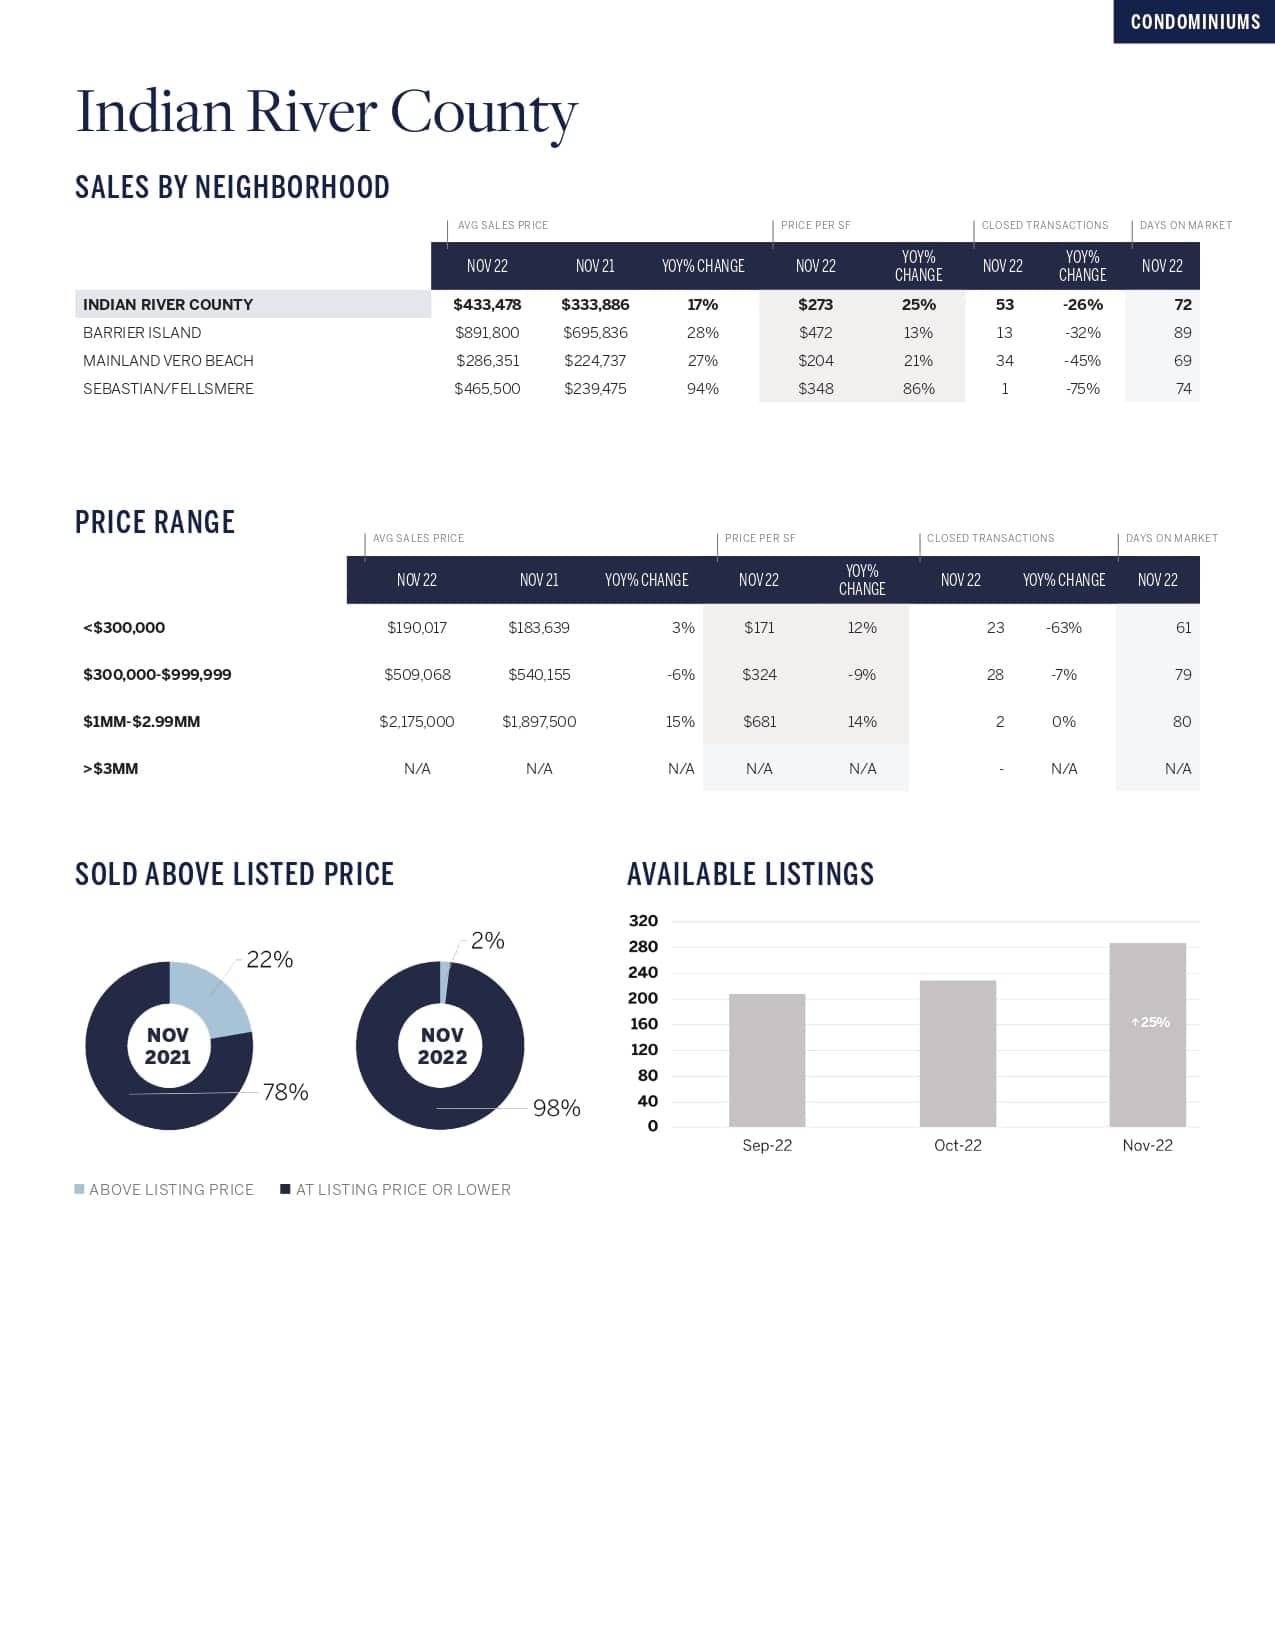
Indian River County real estate trends infographic with neighborhood sales tables and charts comparing November 2021 and 2022.

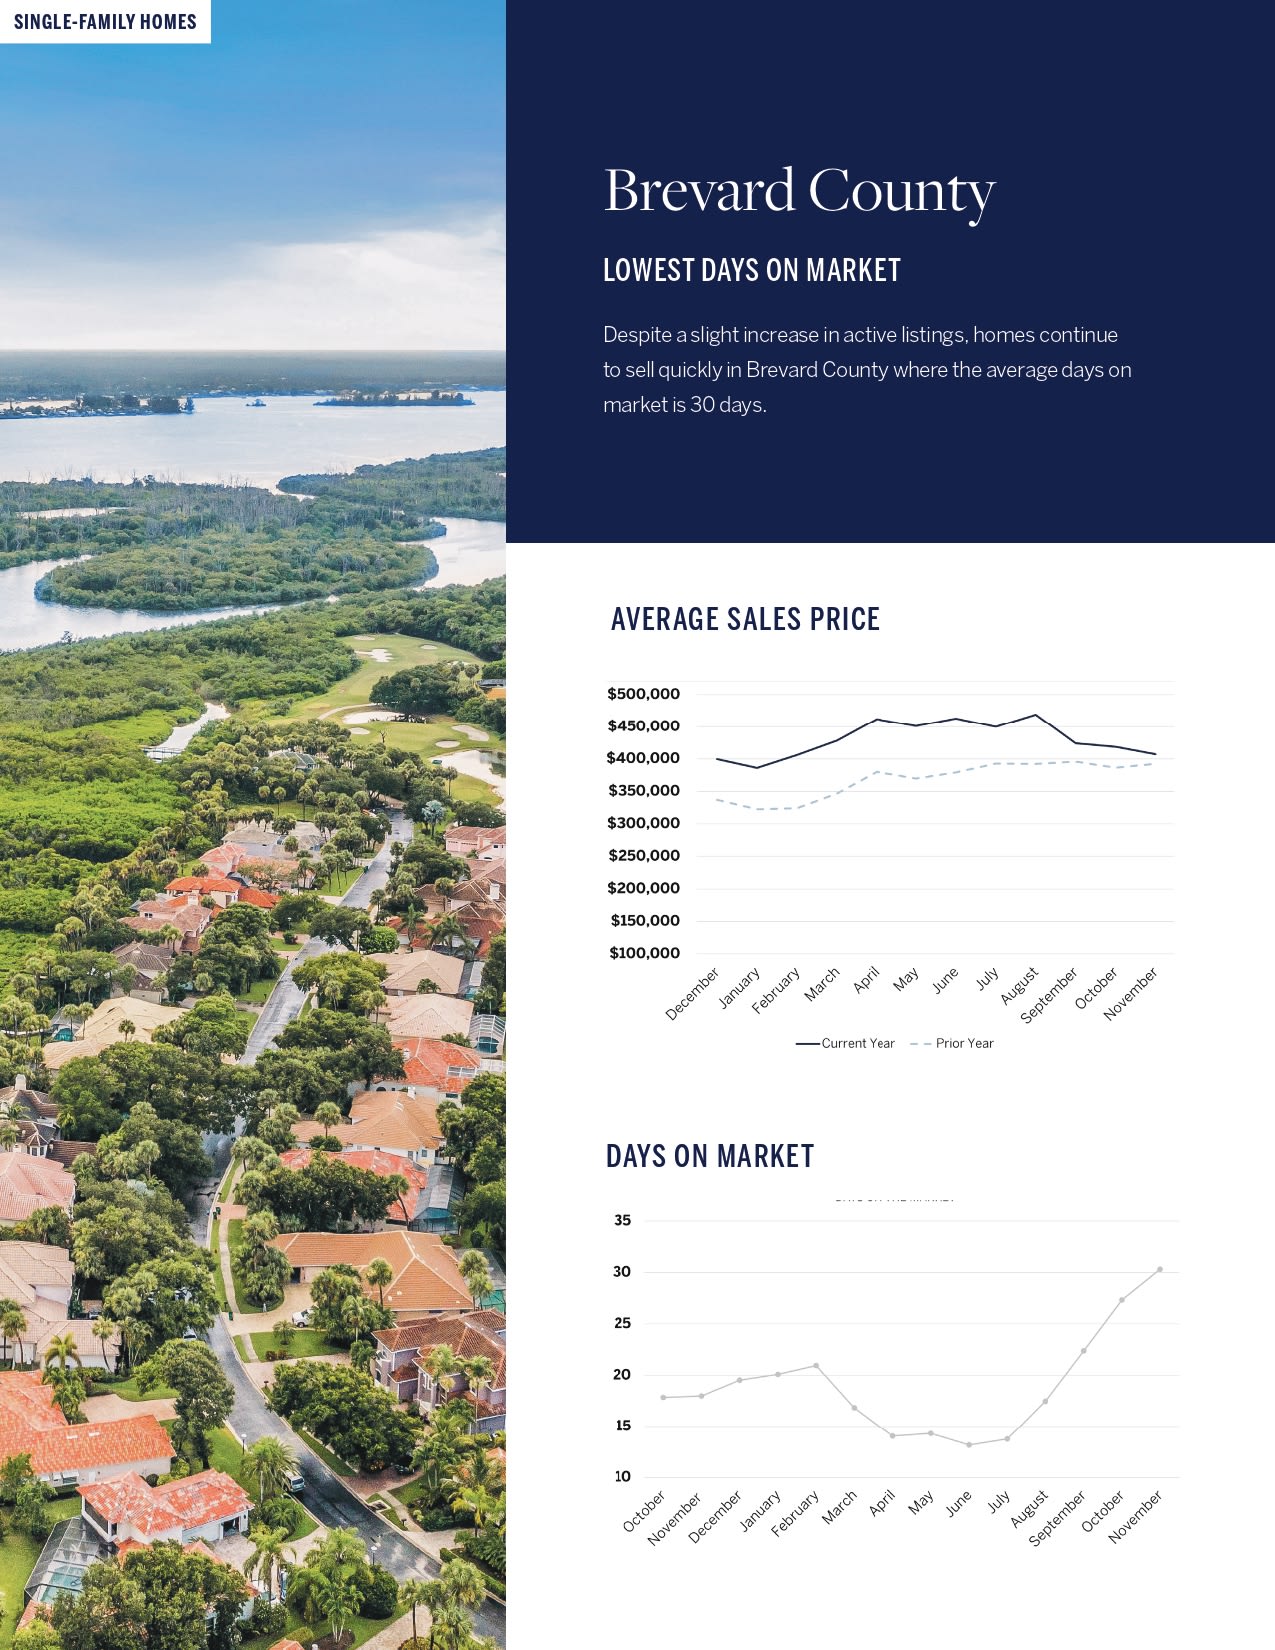
Brevard County housing market infographic with an aerial neighborhood photo and charts for prices and days on market.

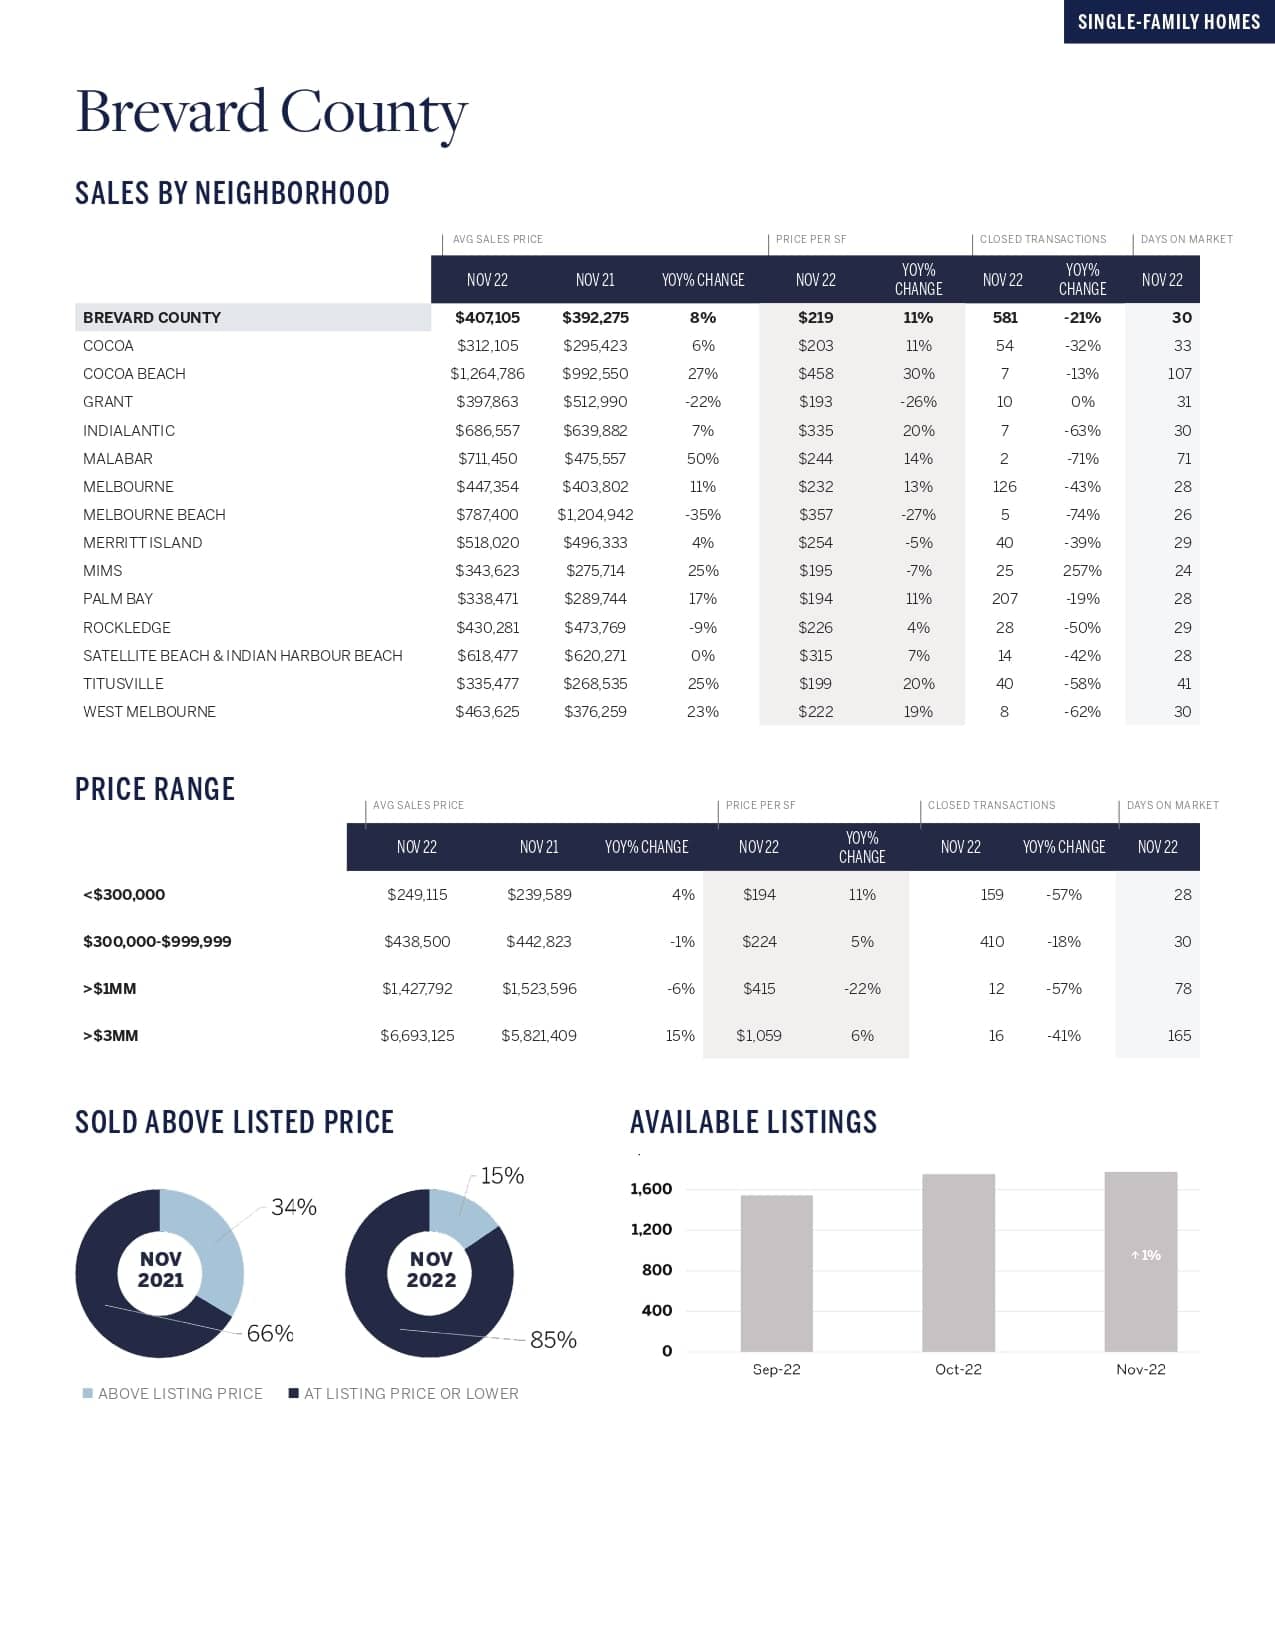
Brevard County November 2022 housing trends, with neighborhood and price-range tables, sale-price donuts, and listings chart.

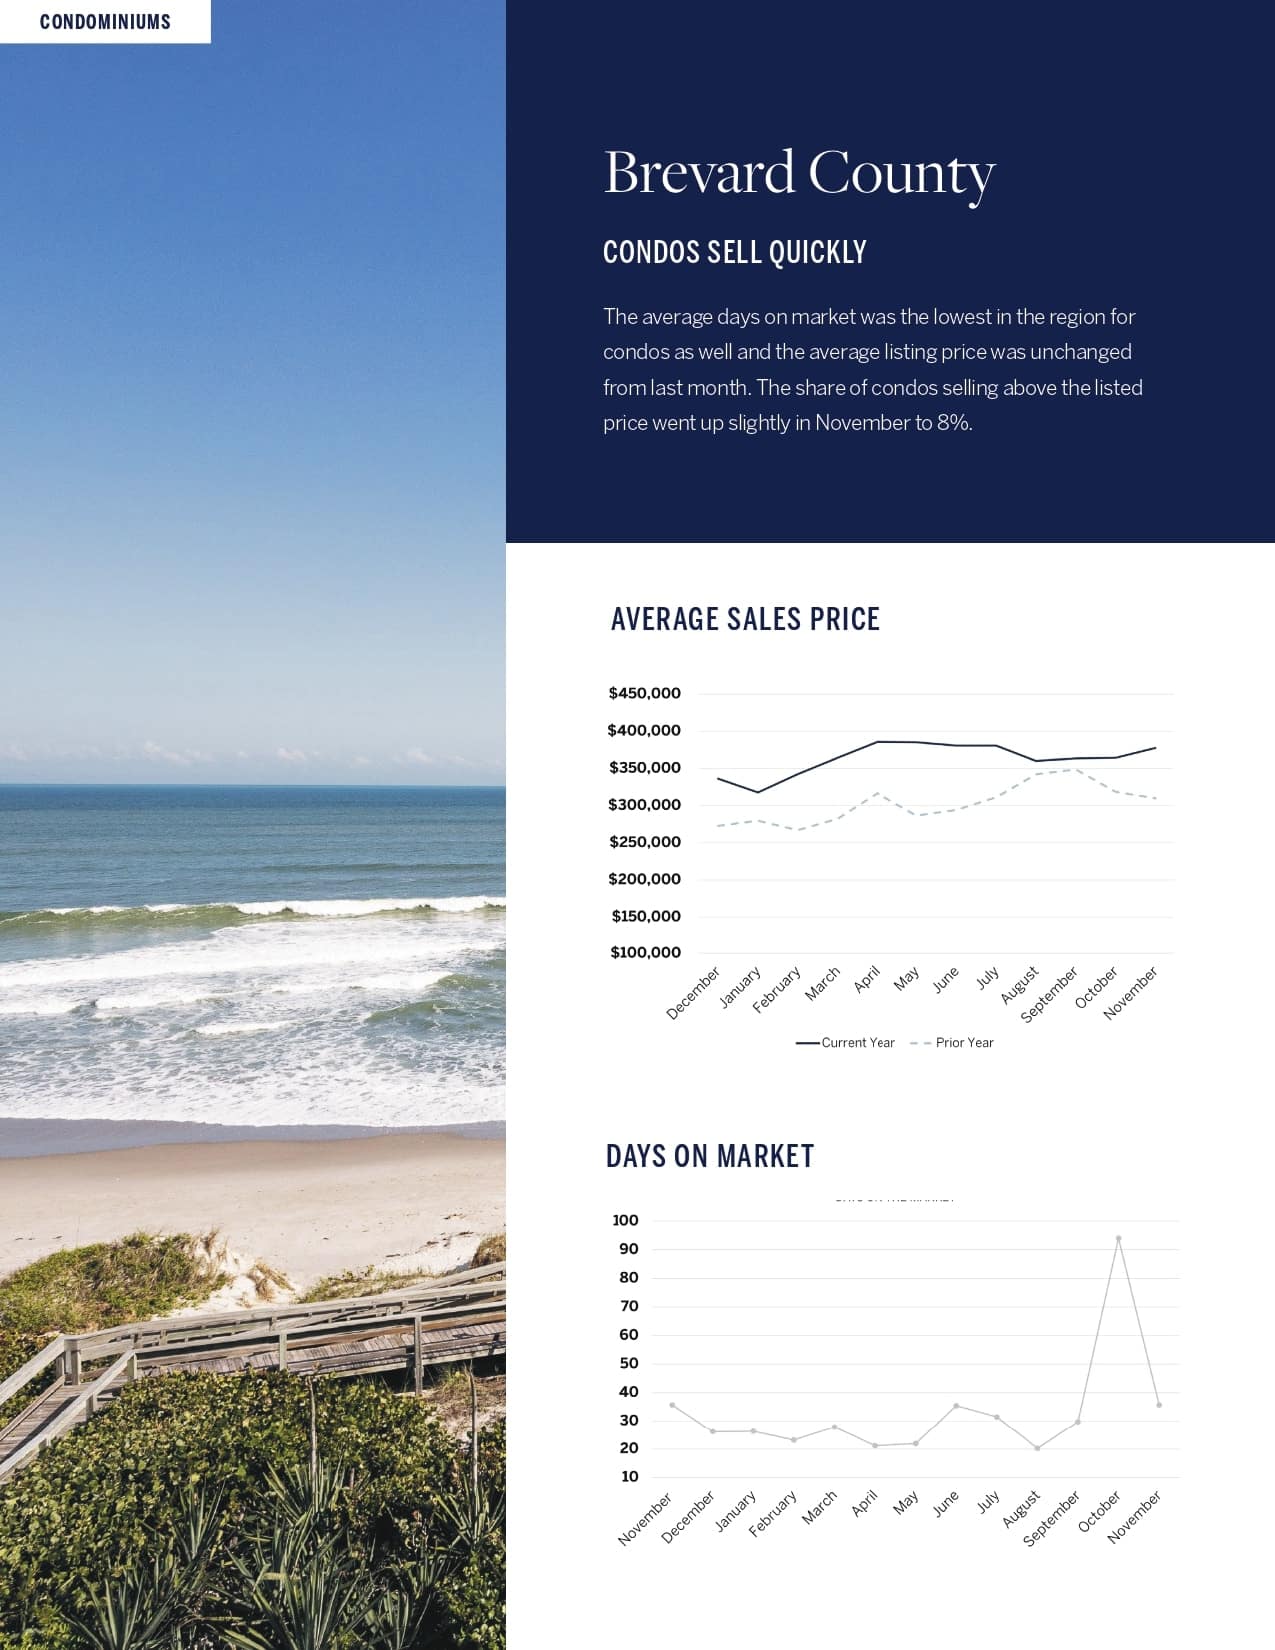
Brevard County condominium market infographic with beach photo and charts comparing sales prices and days on market.

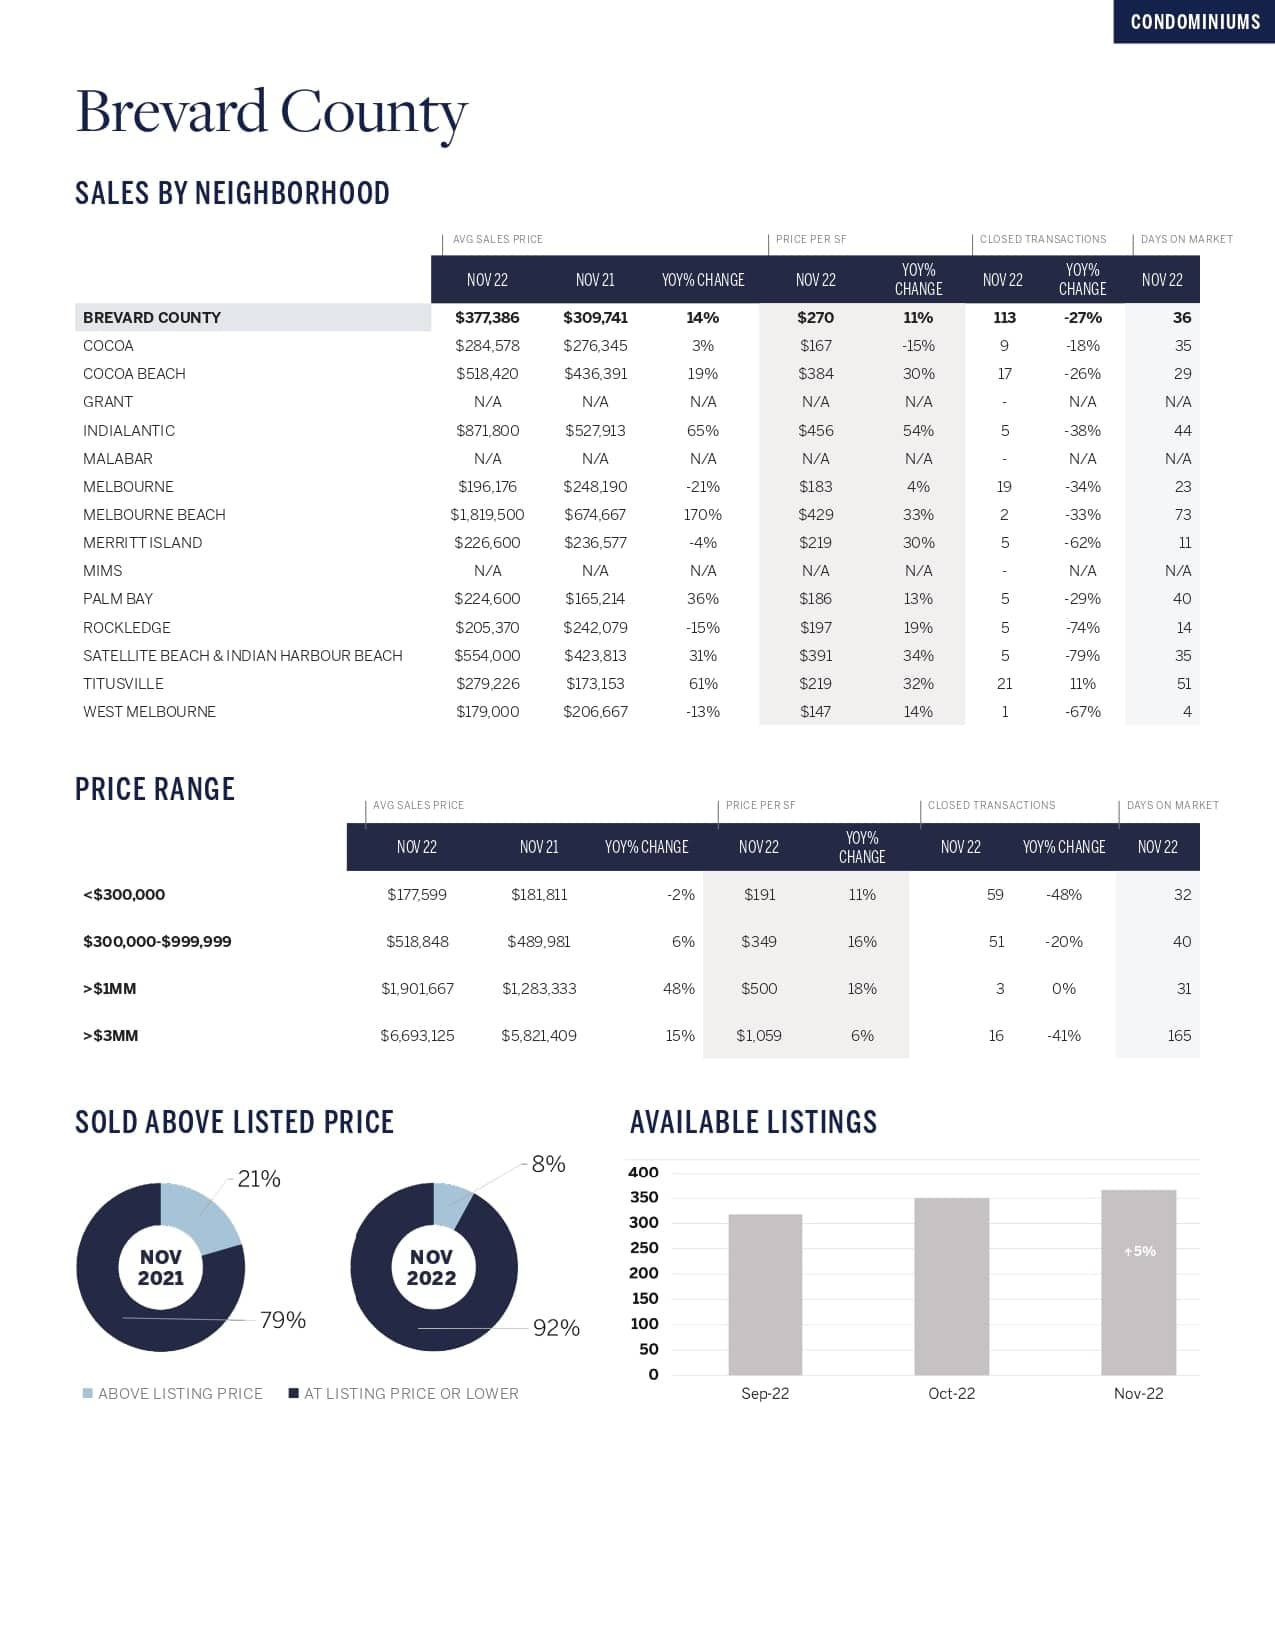
Brevard County market trends infographic with neighborhood sales tables, price-range data, and listing charts.

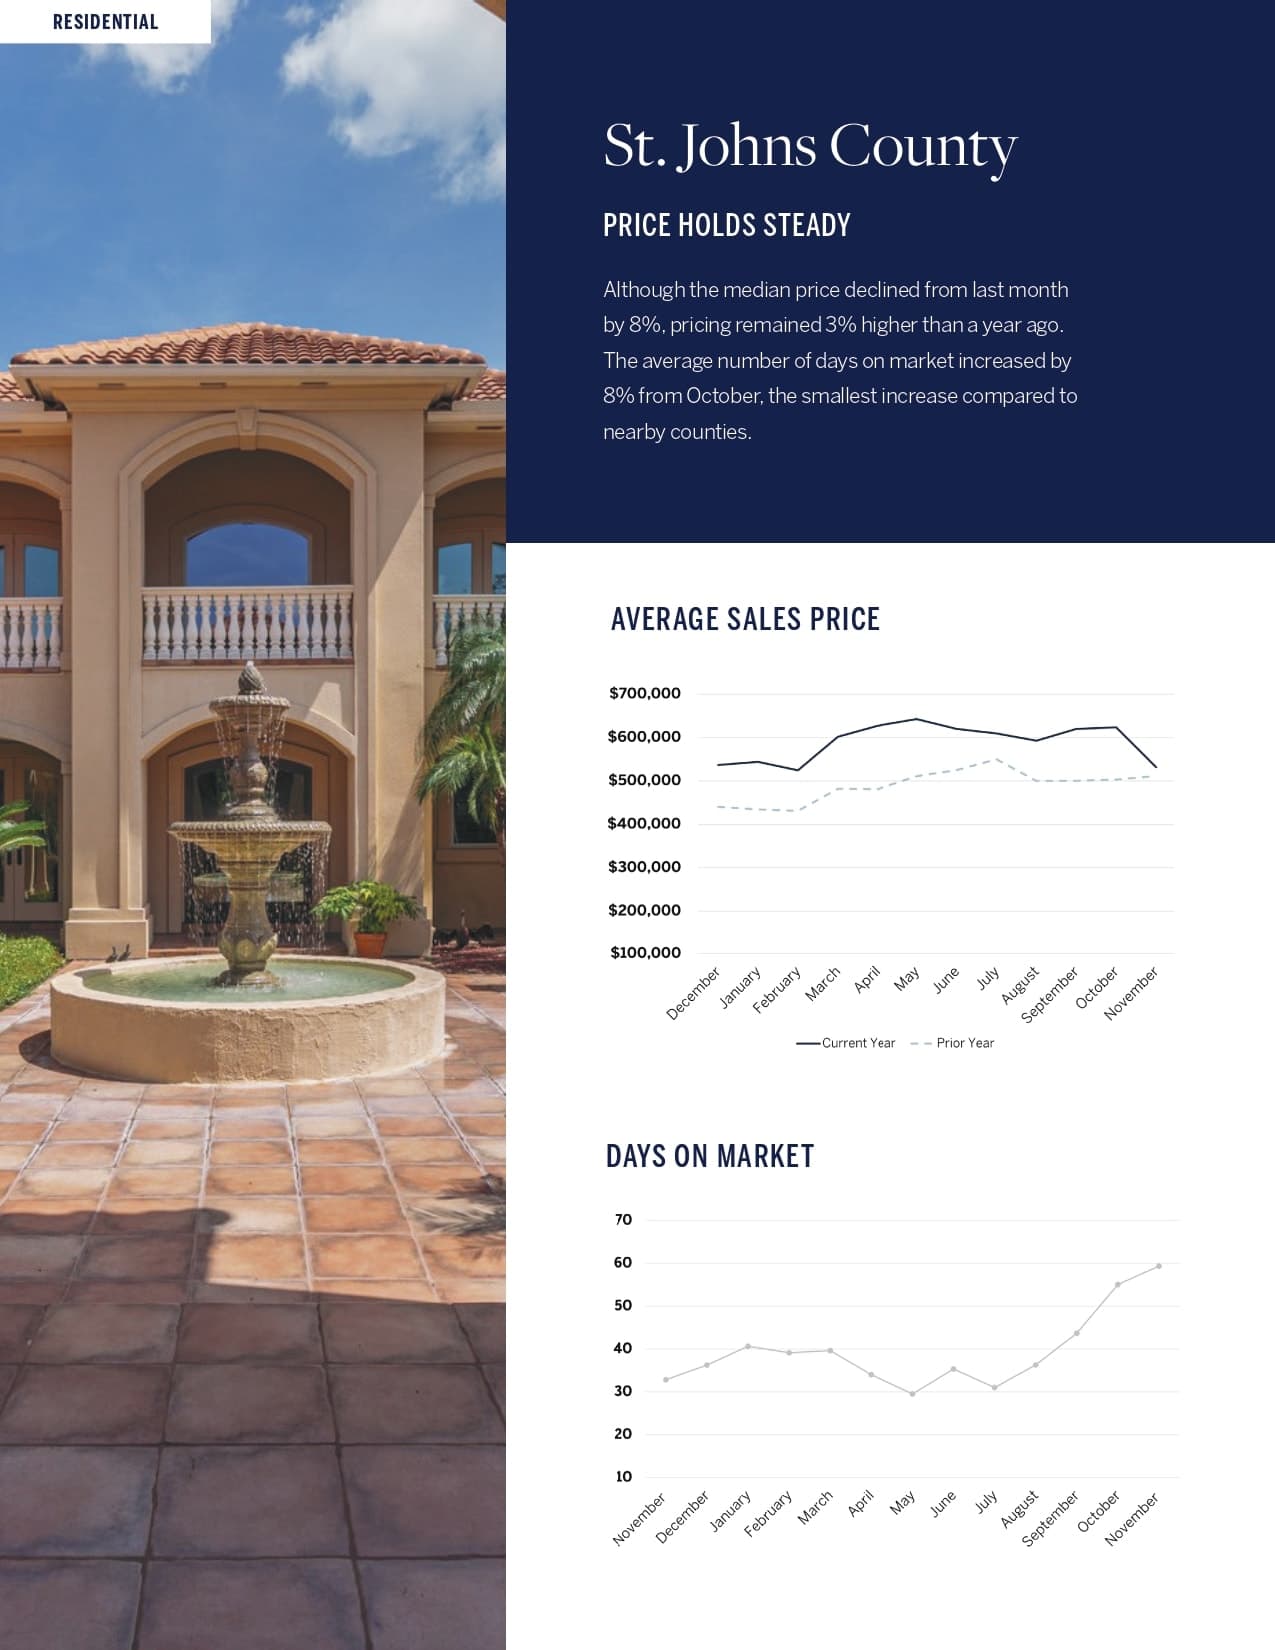
St. Johns County residential market trends infographic with a courtyard home photo and sales-price and days-on-market charts.

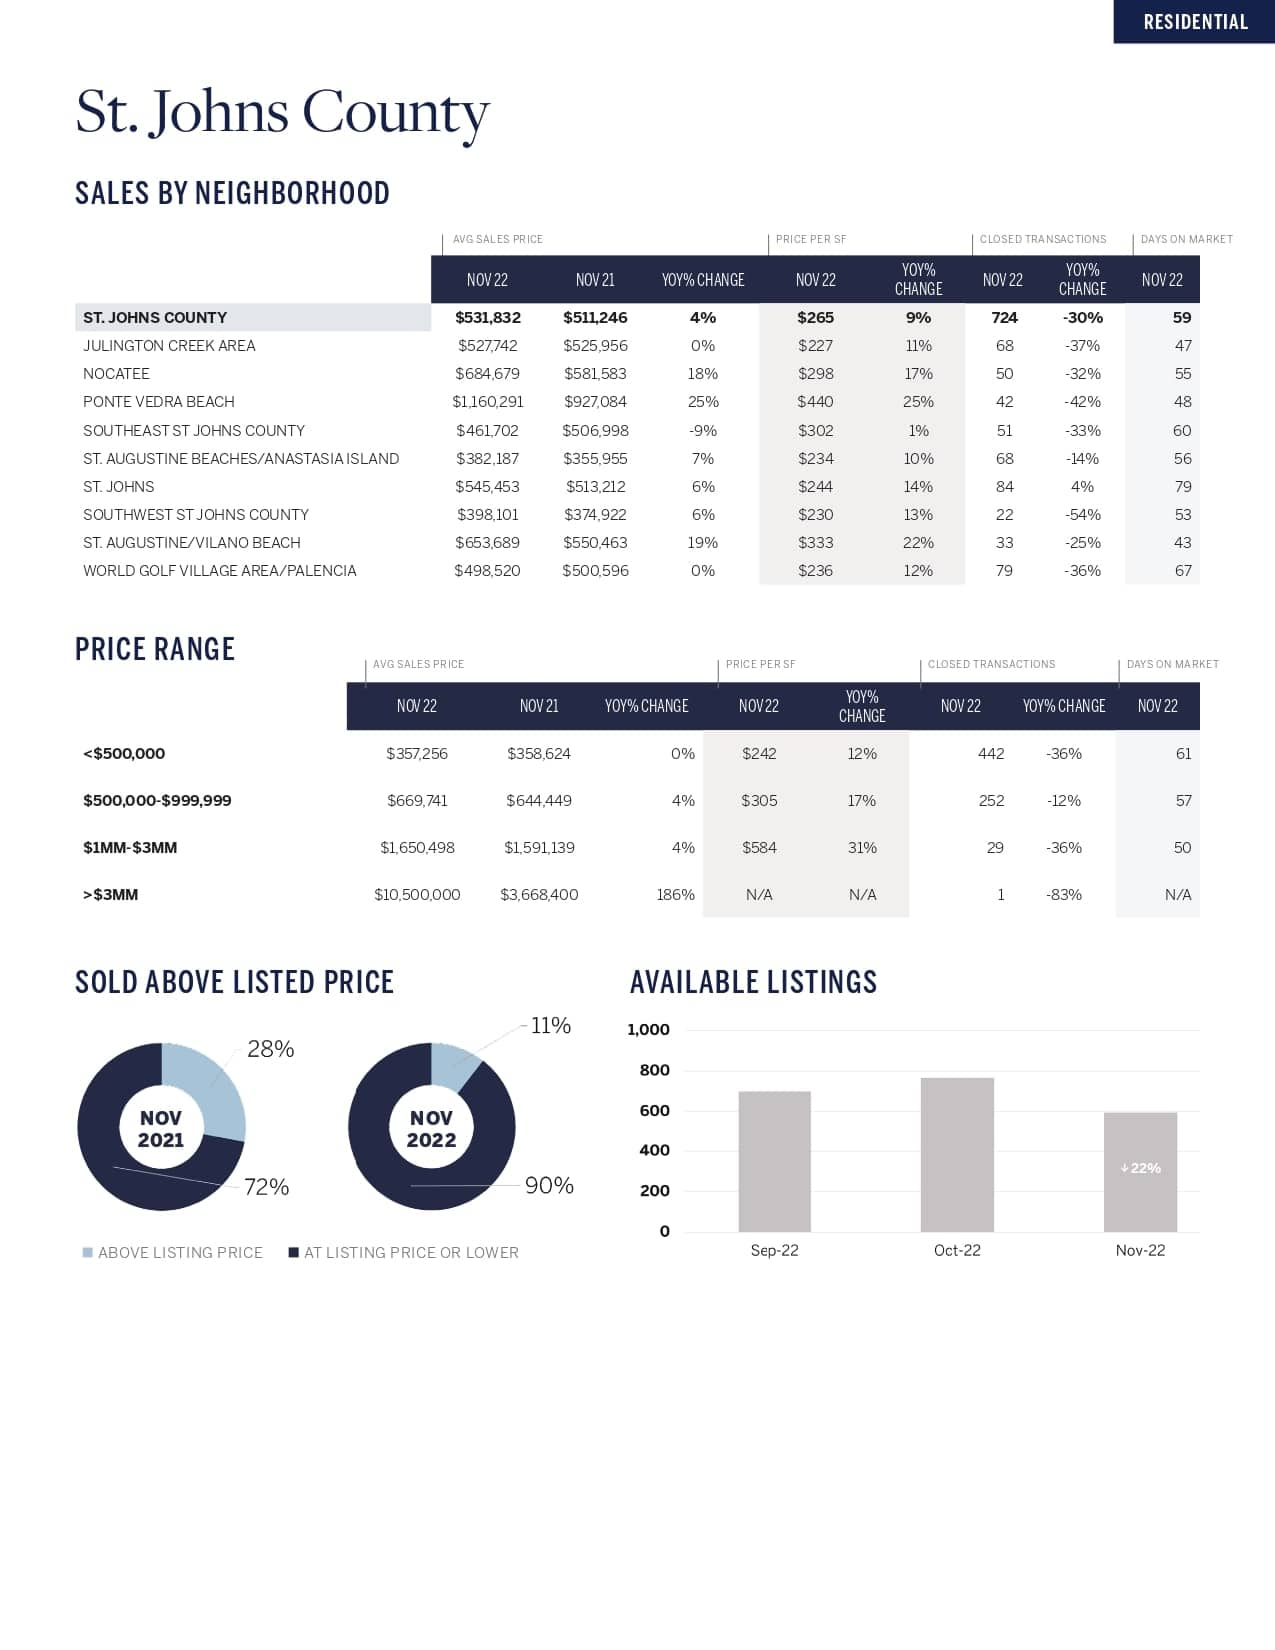
St. Johns County market infographic with neighborhood sales tables, price-range comparisons, and charts for listings and sale prices.

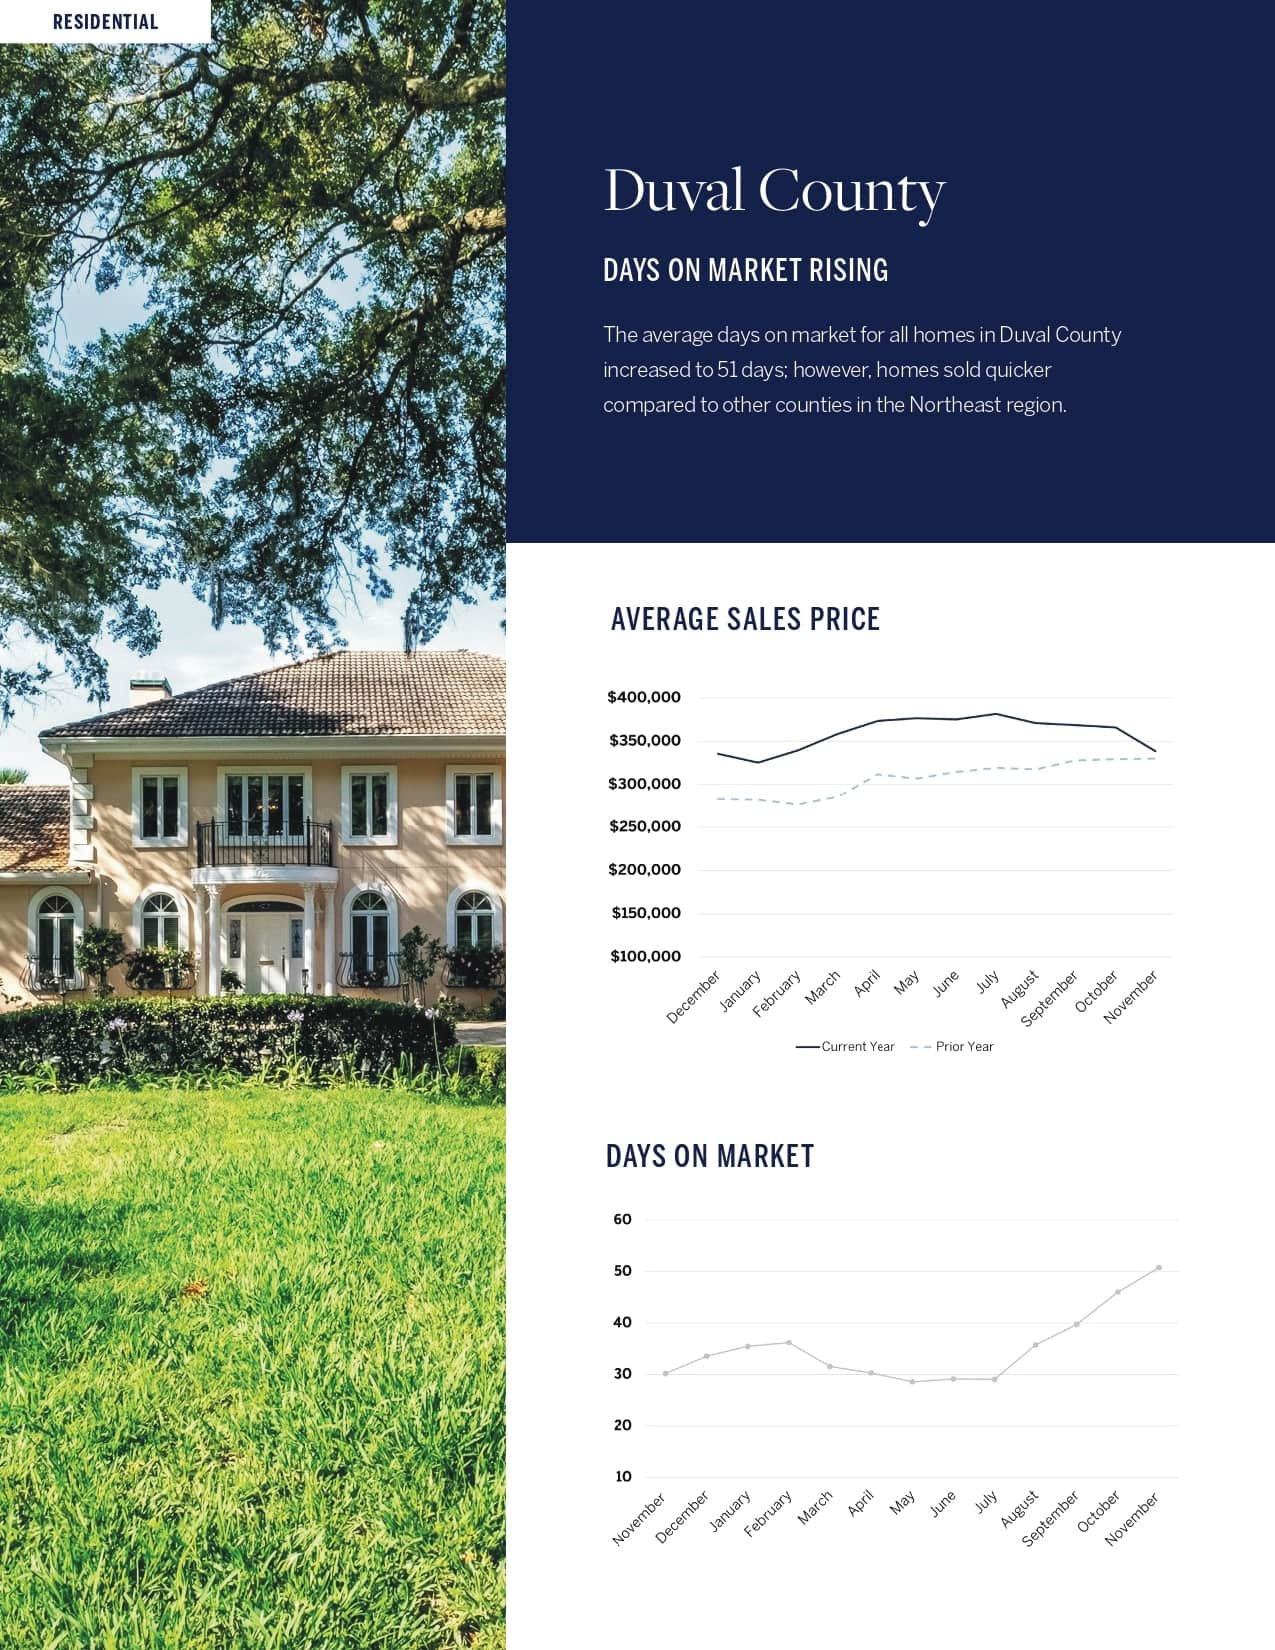
Duval County residential trends infographic with a house photo and charts for average sales price and days on market.

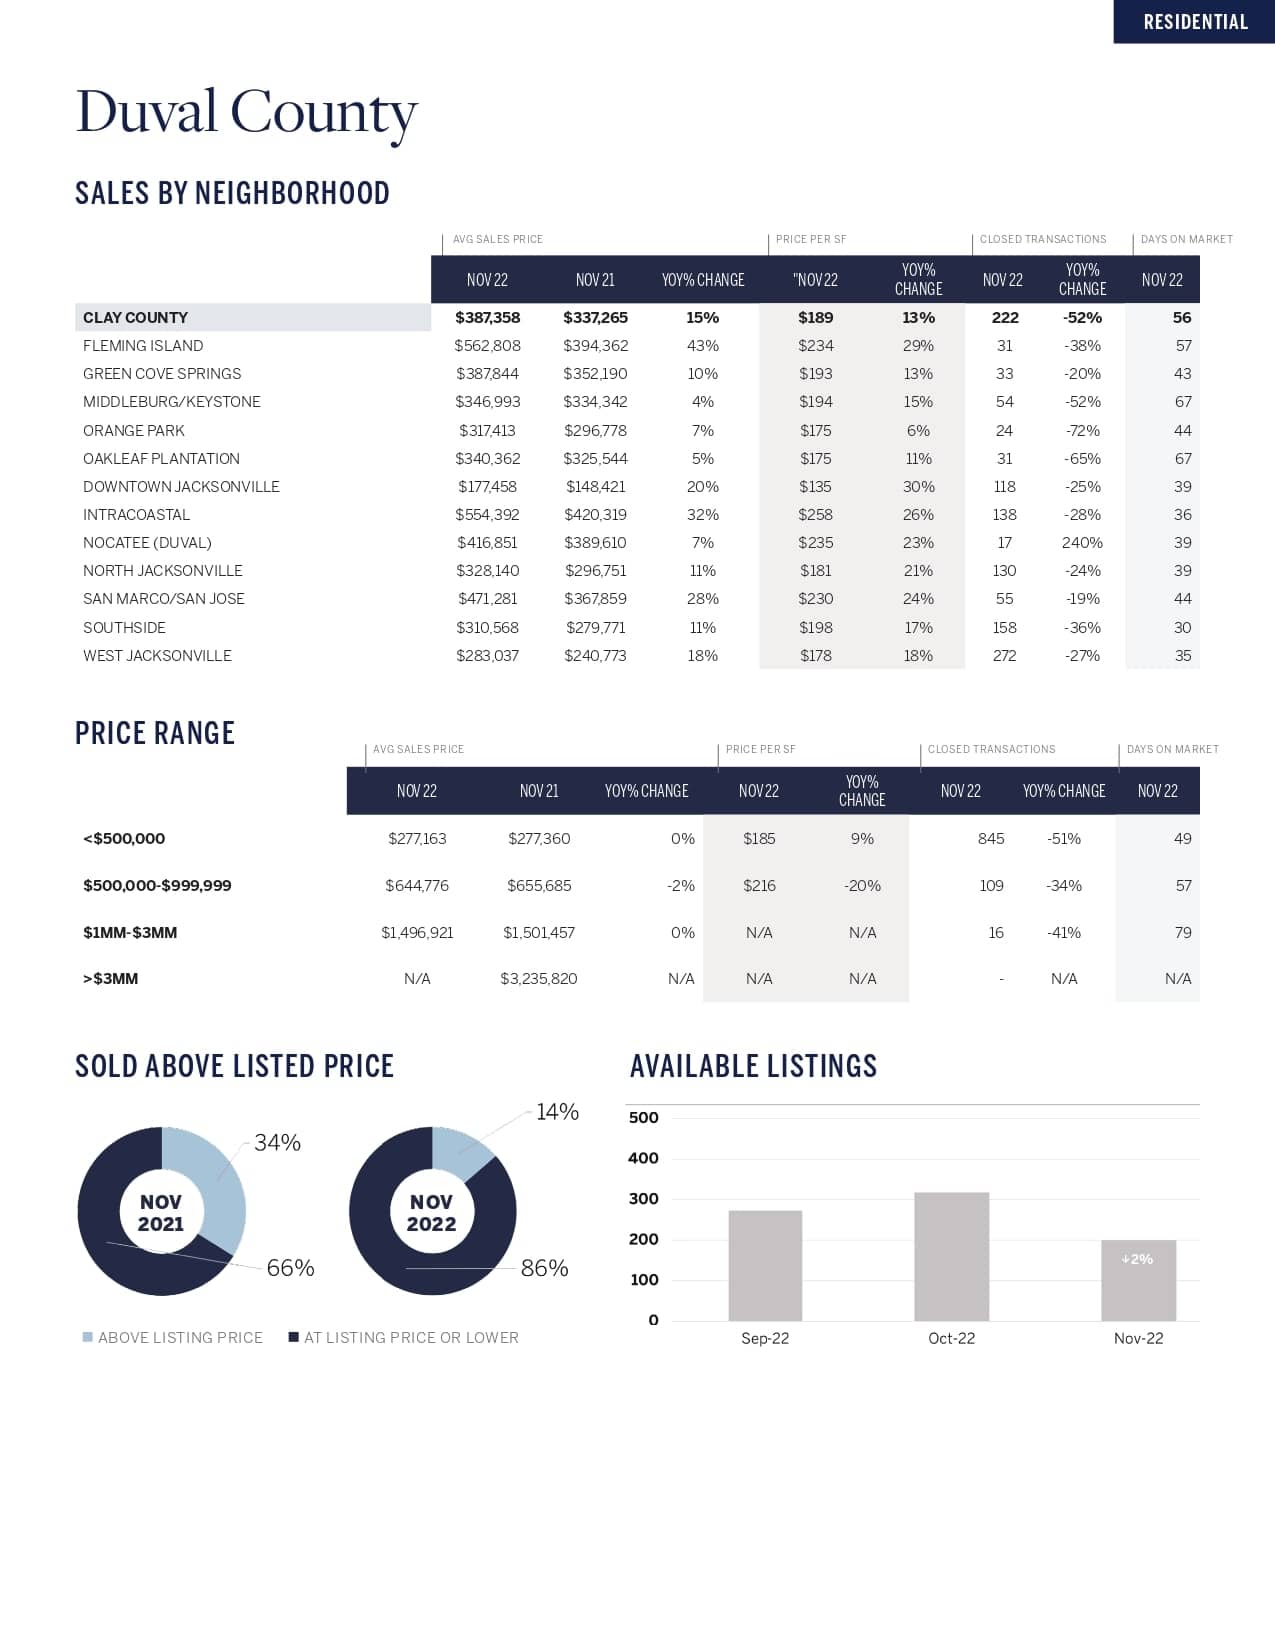
Duval County November 2022 market infographic with neighborhood sales tables, price ranges, and listing charts.

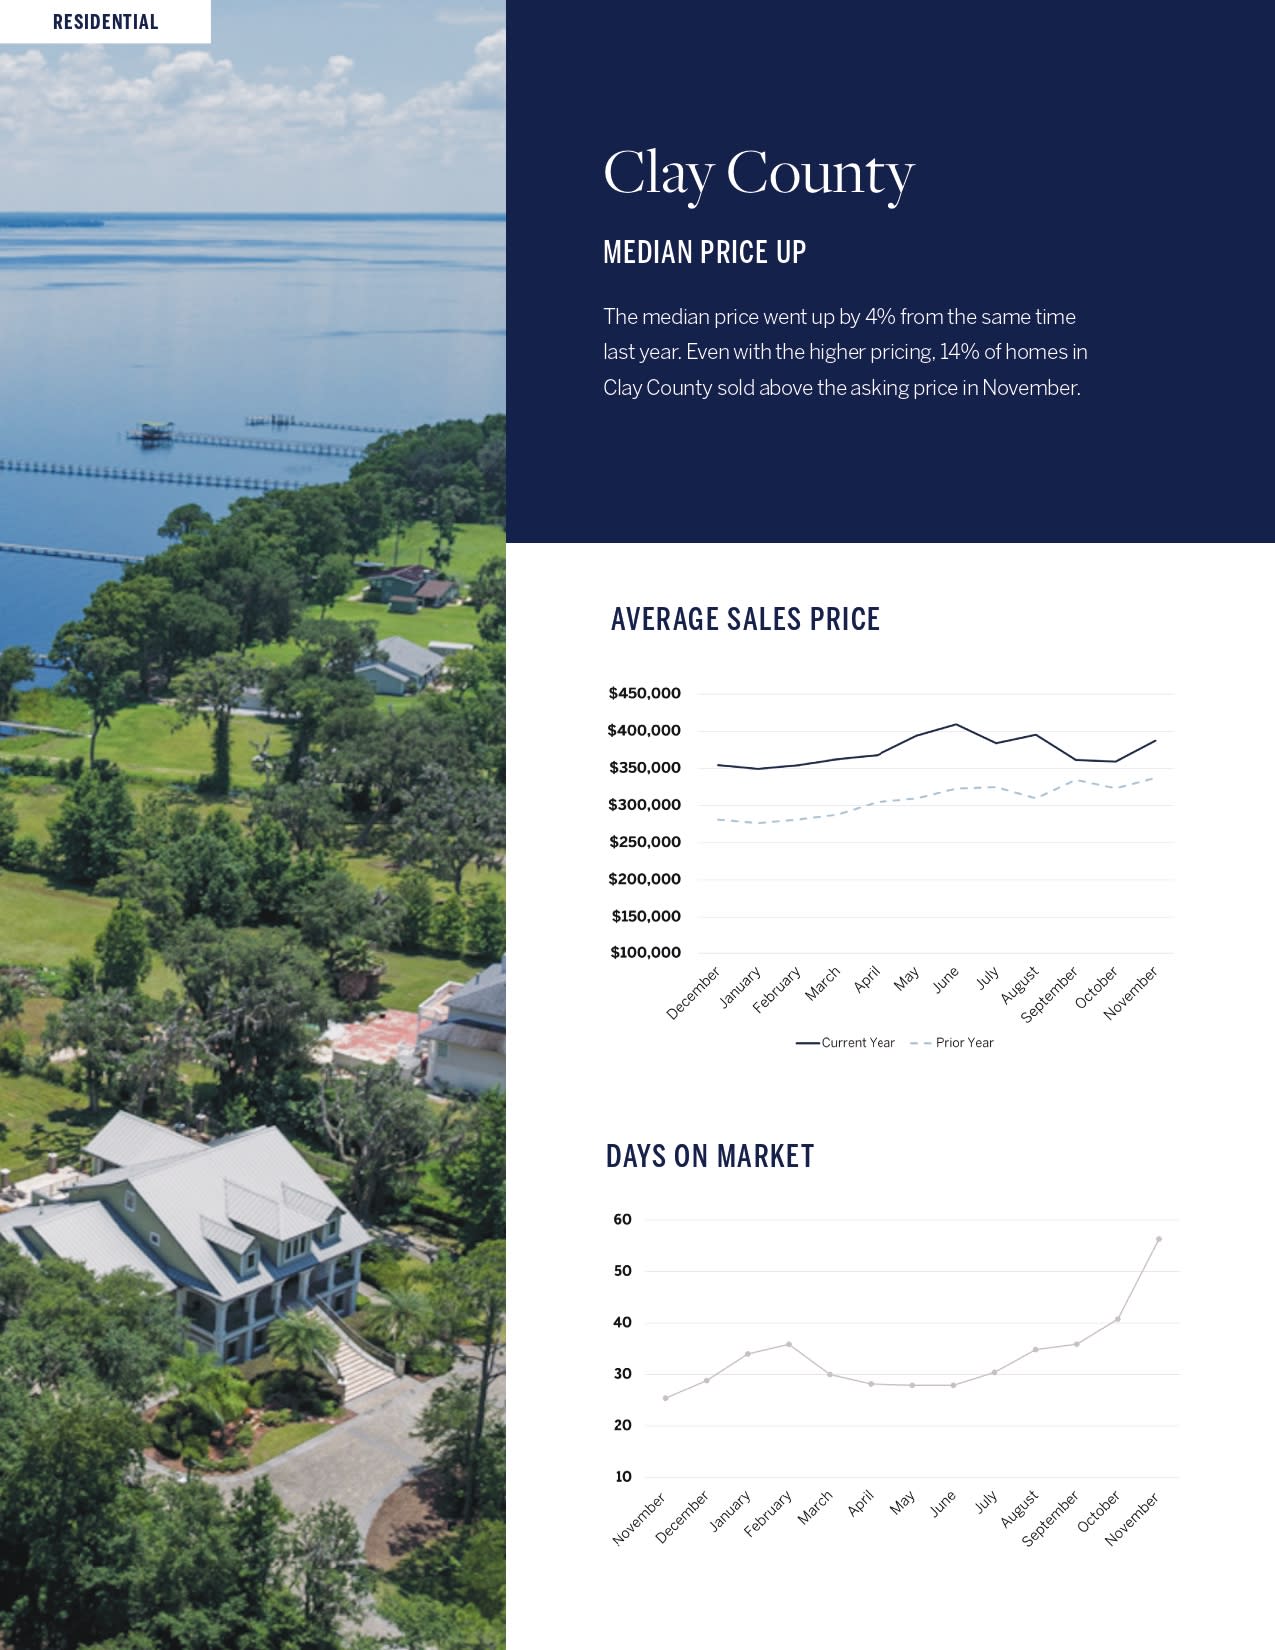
Clay County housing trends infographic with an aerial waterfront neighborhood, median price summary, and market charts.

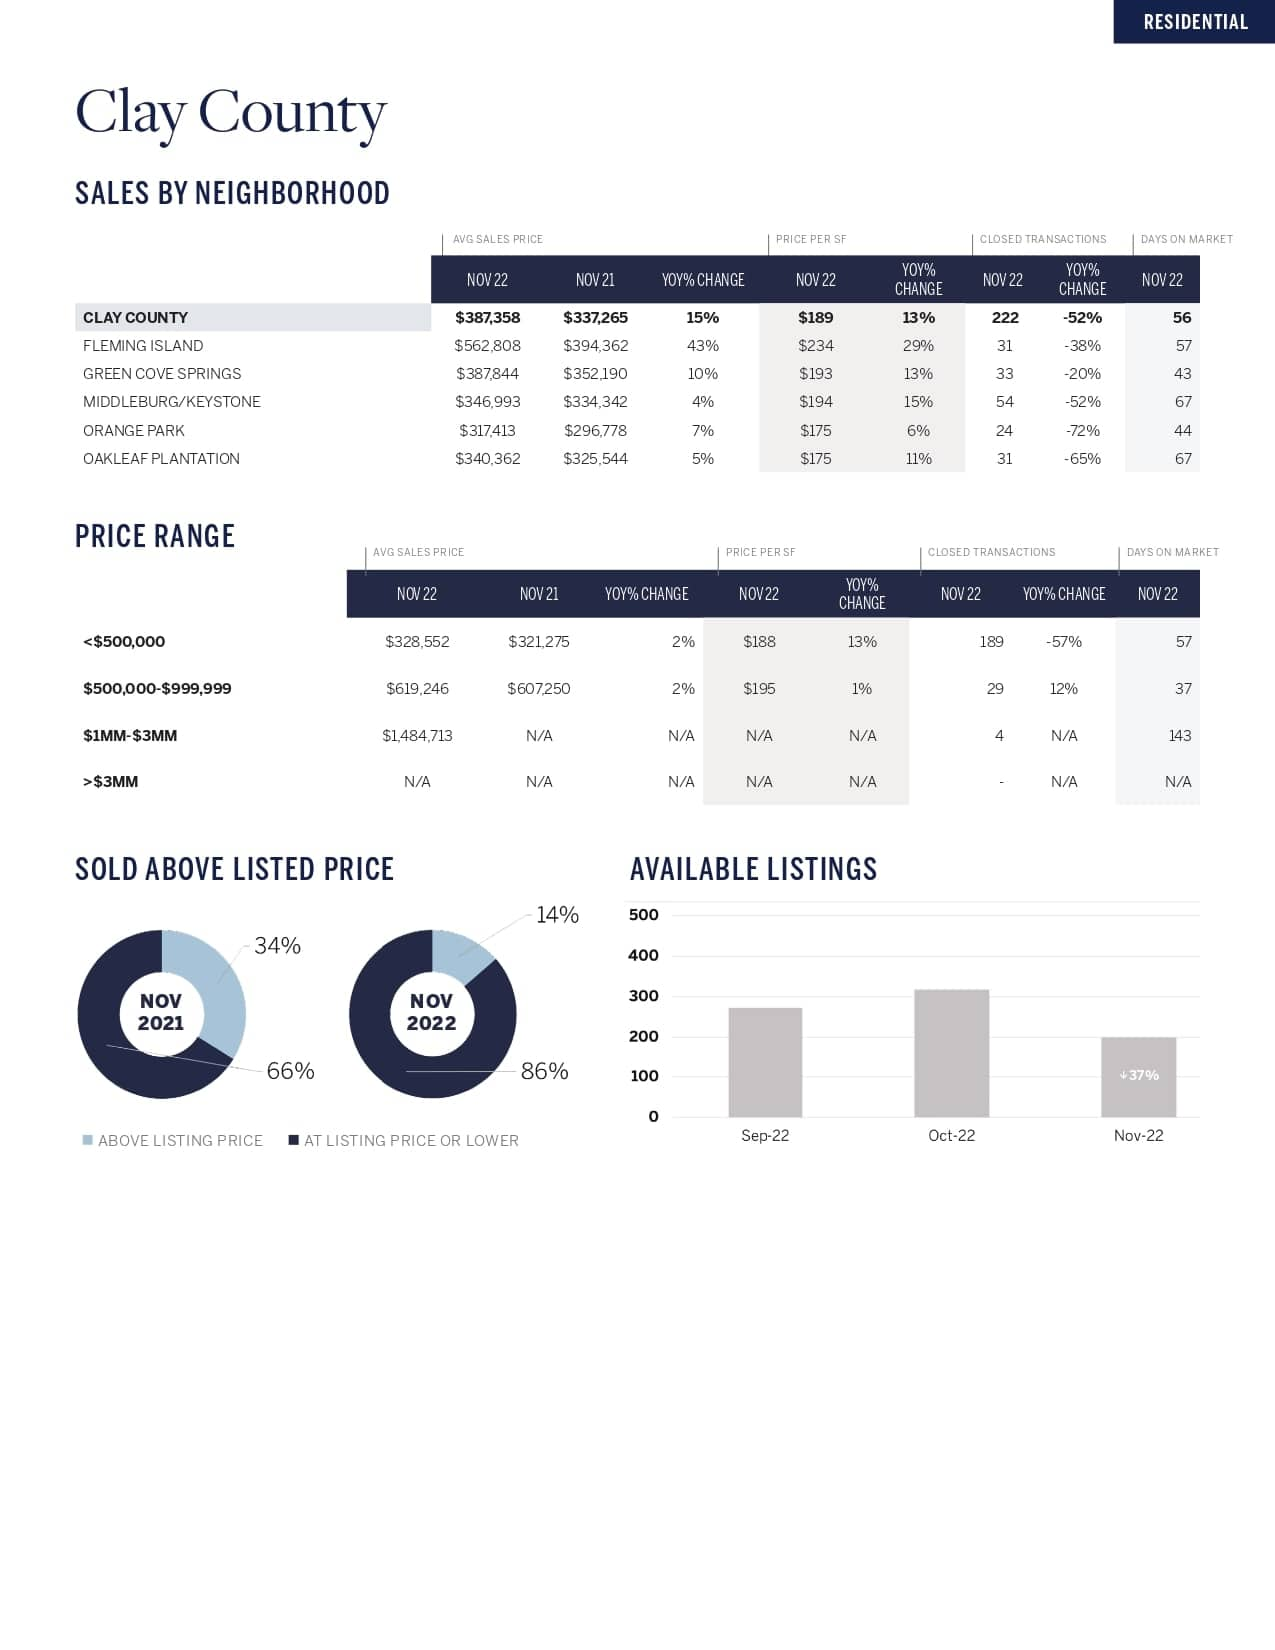
Clay County residential market infographic comparing neighborhood sales, price ranges, list-price results, and available listings.

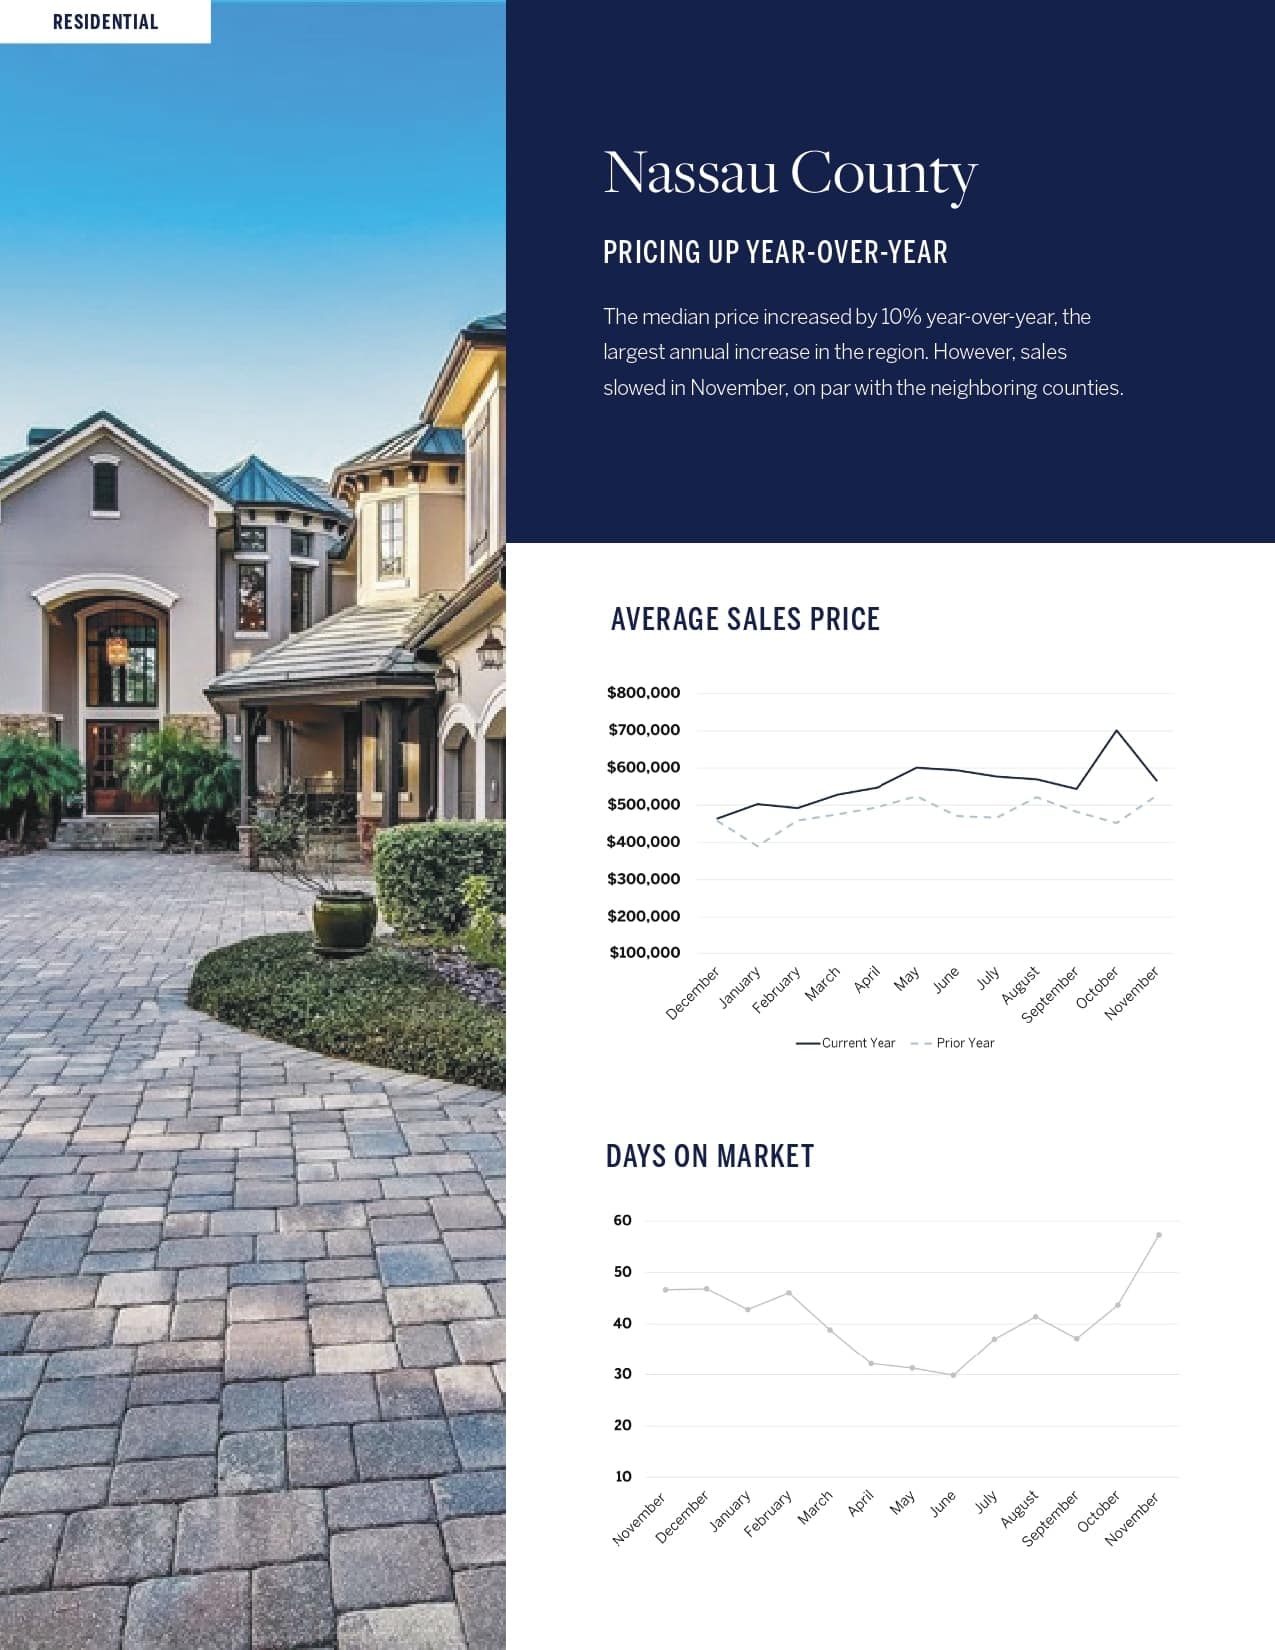
Nassau County real estate trends infographic with a home photo and charts of sales prices and days on market.

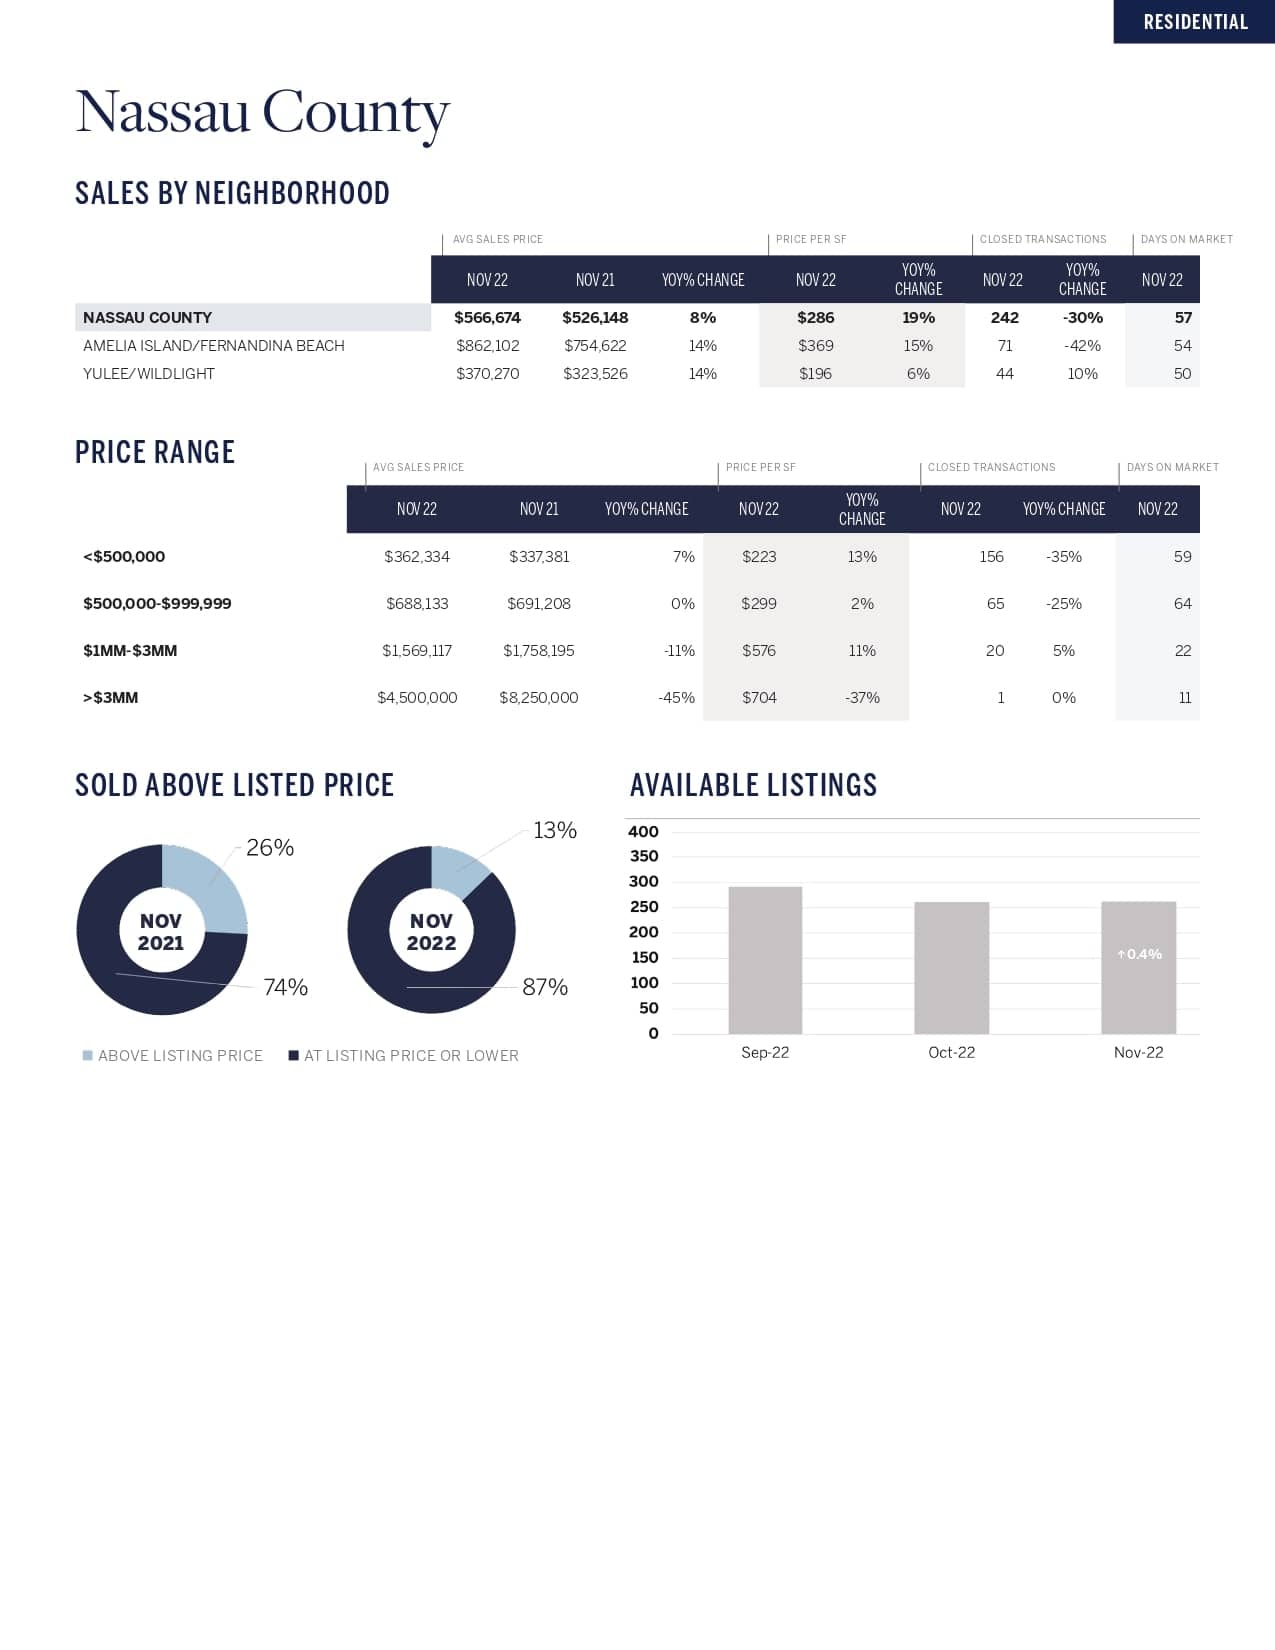
Nassau County November 2022 real estate trends infographic, with sales statistics, list-price comparisons, and available listings.

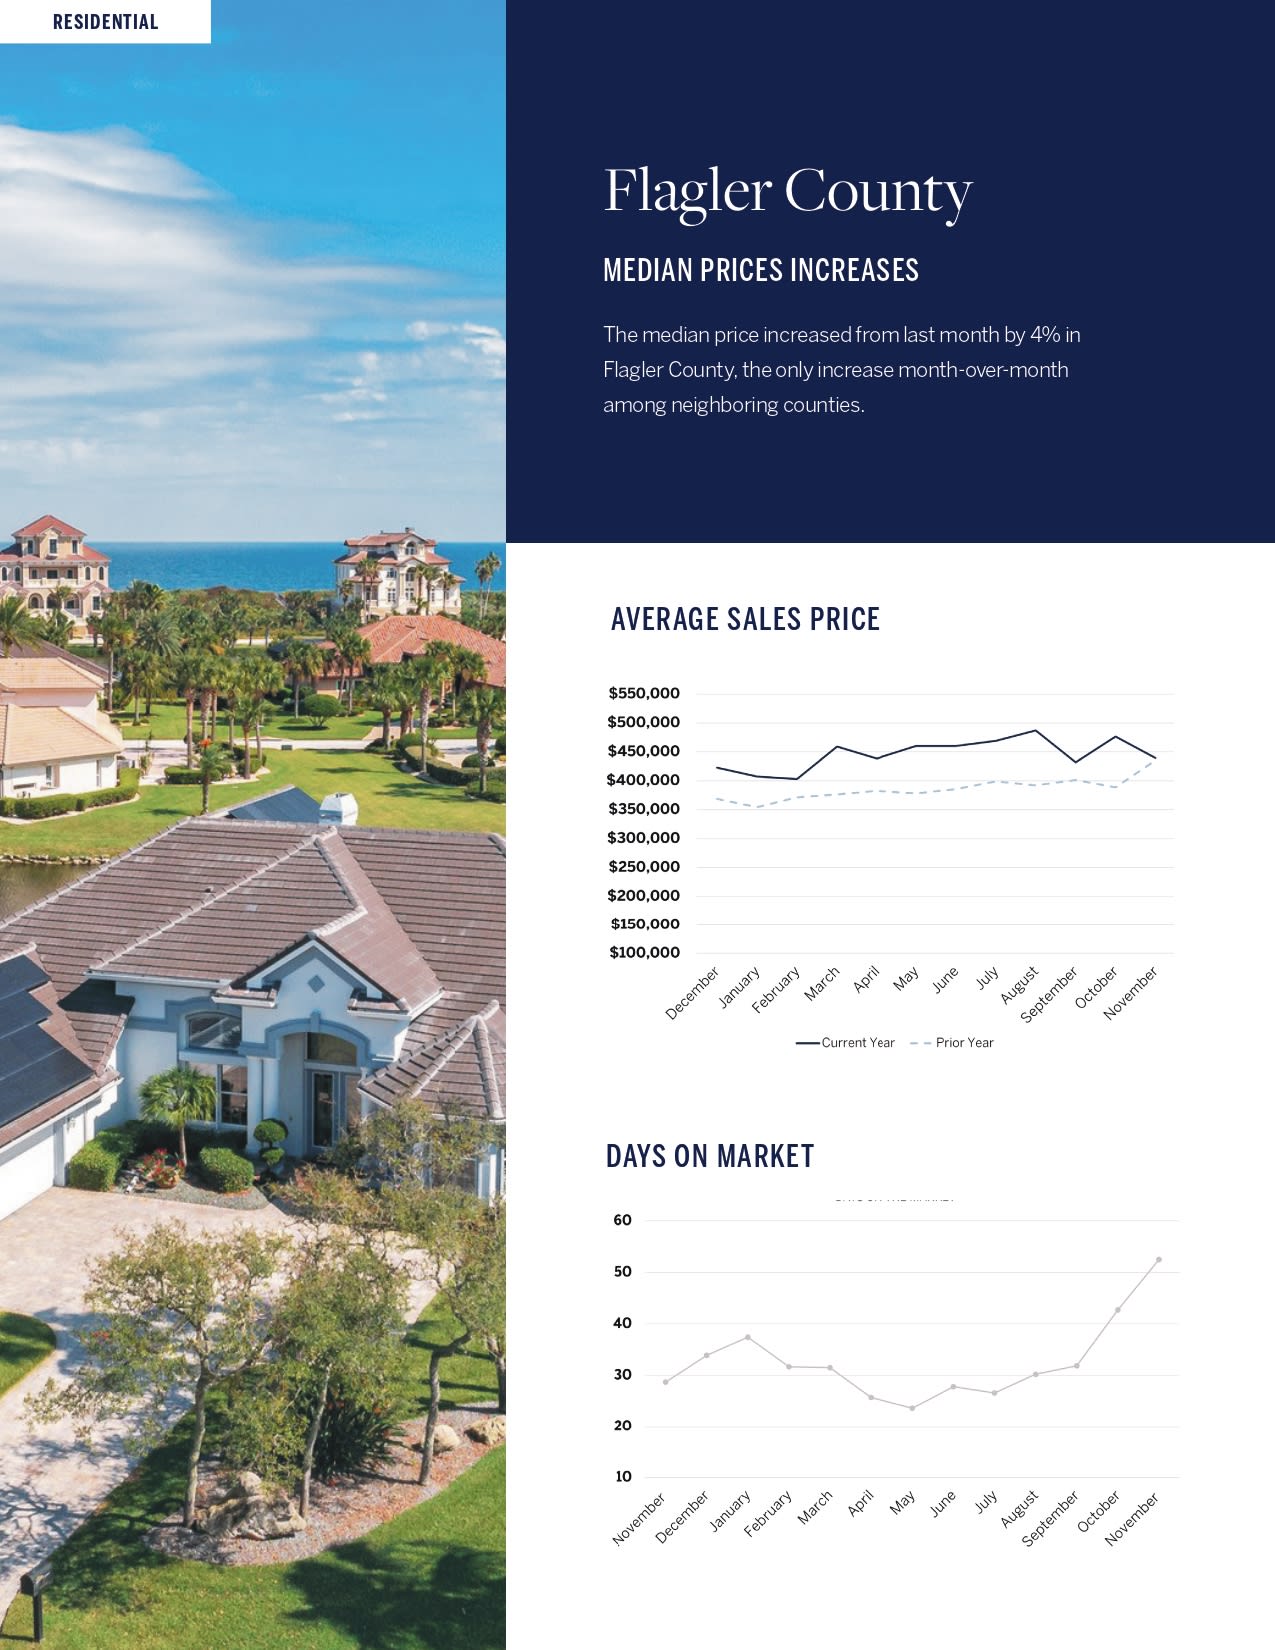
Flagler County real estate trends infographic with average sales price and days-on-market charts.

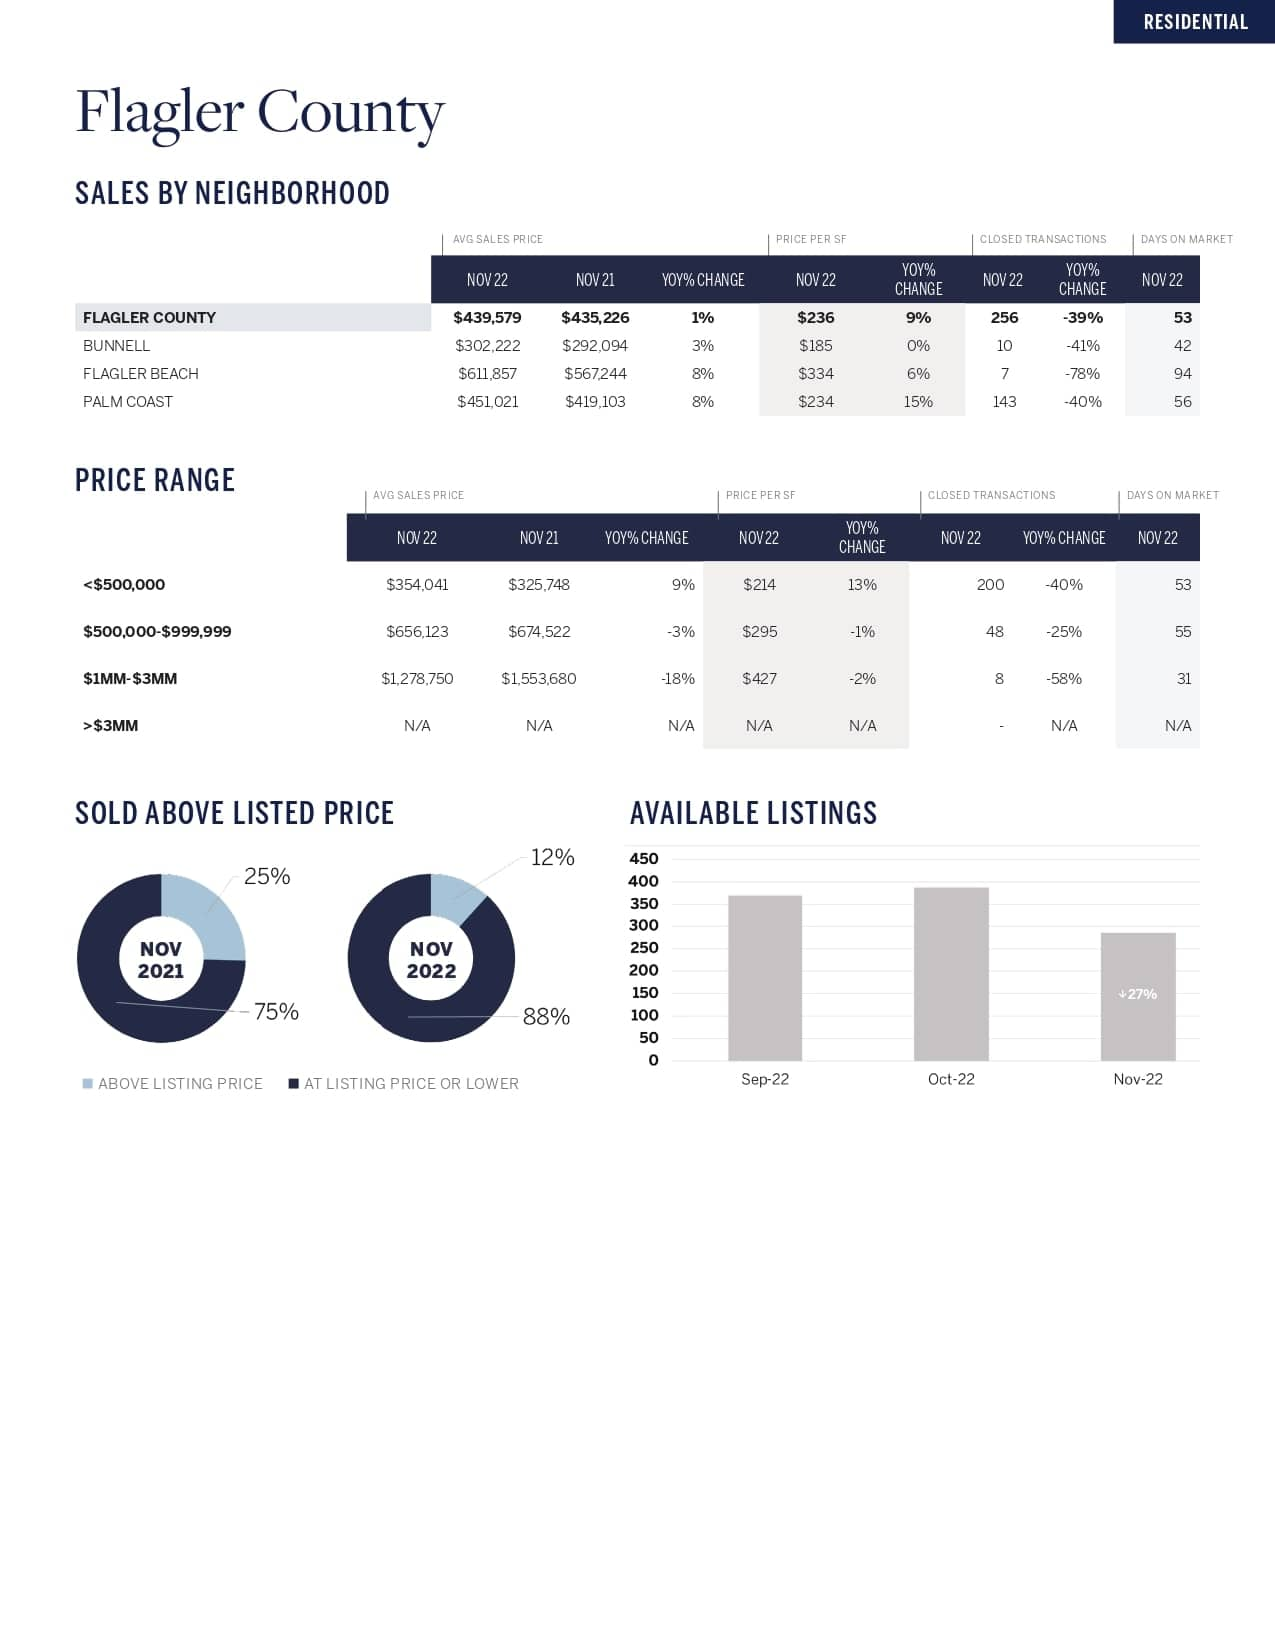
Flagler County November 2022 real estate trends, with sales tables, listing-price charts, and available listings.

ONE Sotheby’s International Realty


View and/or download the latest Trends Summary:
 
CLICK HERE>>For Trends

Call Patrick For Real Estate 3.0 Results!

After years as a marketing, innovation and business guru…and decades buying/selling waterfront properties, I set out to build a 3.0 approach to help my clients. The result is a buying and selling approach that gives you an added advantage…greater results, satisfaction and immediate to longer term value. We would love to work with you…just say Patrick let’s go!

Contact Us

Follow Us on Instagram